Content
Published:
This is an archived release.
Decline in ICT goods trade
In 2009, Norway experienced a fall in ICT exports and imports as well as total exports and imports. ICT imports declined faster than ICT exports, improving the ICT trade balance.
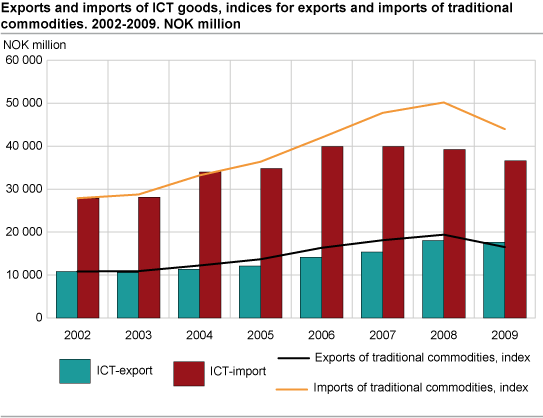
In 2009, ICT imports decreased by 6.7 per cent and amounted to NOK 36.6 billion. ICT exports fell 2.3 per cent to NOK 17.7 billion. The ICT trade deficit went down from NOK 21.1 billion in 2008 to NOK 18.9 billion in 2009; the lowest value since 2003.
Increase in ICT goods’ share in total exports and imports
In 2009, exports and imports of traditional commodities fell for the first time over the period 2002-2009. Total exports (all commodities excluding ships, oil platforms, crude oil, natural gas and condensates) decreased by 14.9 per cent to NOK 305 billion. Total imports (all commodities excluding ships and oil platforms) went down 12.3 per cent and were worth NOK 424 billion. ICT exports and imports dropped more slowly than exports and imports of traditional commodities. As a result, ICT goods’ share in total exports and imports increased. ICT imports accounted for 8.6 per cent of total imports; 0.5 percentage points higher than in 2008. The share of ICT goods in total exports reached a peak of 5.8 per cent; the highest over the period 2002-2009.
Computers dominating ICT imports
Imports of computer and related equipment were worth NOK 11.6 billion and made up 32 per cent of total ICT imports (see “About the statistics” for supplementary information). The largest segment in ICT exports in 2009 was other ICT goods , with an export value of NOK 6.2 billion and a share of 35 per cent in ICT exports. Other ICT goods comprise, among other things, navigational and measuring instruments.
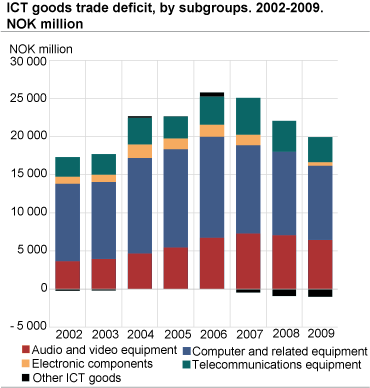
Reduced trade deficit in telecom and computers
The trade balance was improved in all segments of ICT trade except electronic components . The reduction in trade deficit was largest for telecommunications equipment and computer and related equipment : 17.7 and 11.5 per cent respectively. Trade surplus in other ICT goods continued to grow, from NOK 889 million in 2008 to NOK 1 billion in 2009. For all these subgroups the improvements in the trade balances came from the import side.
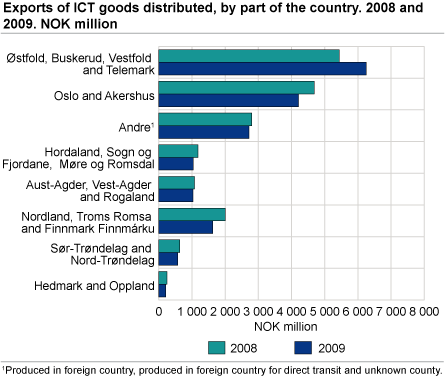
Growth in ICT exports from Østfold, Buskerud, Vestfold and Telemark
When ICT goods are shipped, the county of origin is registered for exports and the customhouse is registered for imports. Based on these register data, exports and imports of ICT goods are distributed by region.
In 2009, only the counties of Østfold, Buskerud, Vestfold and Telemark increased their ICT exports. These four counties exported NOK 6.3 billion worth of ICT goods, which is NOK 820 million higher than in 2008.
|
The statistics comprise the product groups audio and video equipment, computer and related equipment, electronic components, telecommunications equipment and other ICT goods. The definitions were created by the OECD in 2003 and differ slightly from the definitions used in these statistics previously. As a result, the figures published in this article may differ somewhat from the figures published in earlier years. Final figures from the statistics on external trade in goods form the basis for this article. All figures are in current prices. See About the statistics for more information . See also statistics on External trade in IT-services for 2008. |
Tables:
- Table 1 Exports and imports of ICT goods. 2002-2009.NOK million
- Table 2 Exports and imports of ICT goods as a proportion of total external trade. 2002-2009. NOK million
- Table 3 Exports and imports of ICT goods and traditional commodities. 2002=100
- Table 4 Imports of ICT goods by part of the country. 2007-2009. NOK million
- Table 5 Exports of ICT goods, by part of the country. 2007-2009. NOK million
Contact
-
Statistics Norway's Information Centre
E-mail: informasjon@ssb.no
tel.: (+47) 21 09 46 42