Content
Published:
This is an archived release.
Import surplus of ICT goods
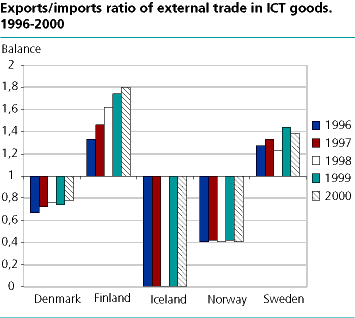
In 2000 external trade in ICT goods showed an import surplus of more than NOK 20 billion. Norwegian exports of ICT goods amounted to about 40 per cent of imports. In the other Nordic countries the export's share was higher.
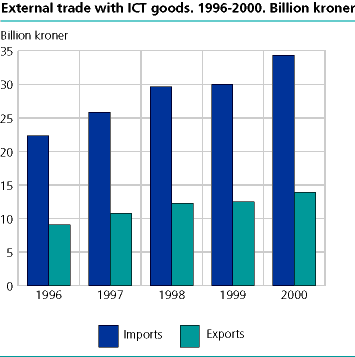
Norway's net import of ICT goods is huge. In 2000 imports were about two and a half times as big as the value of exports. Exports of ICT goods increased in current prices from NOK 9 058 million in 1996 to NOK 13 935 million in 2000, while imports grew from NOK 22 315 million in 1996 to 34 271 million in 2000. In 2000 this resulted in a negative balance of NOK 20 337 million. From 1996 to 2000, the relative trade deficit in such goods fell little. The ratio between exports and imports of ICT goods in Norwegian external trade was 0.407 in 2000 compared with 0.406 in 1996.
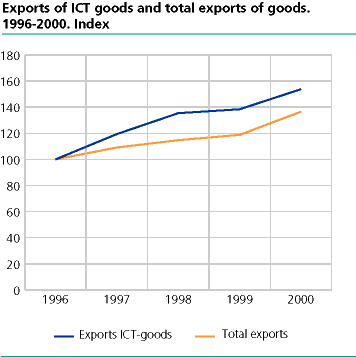
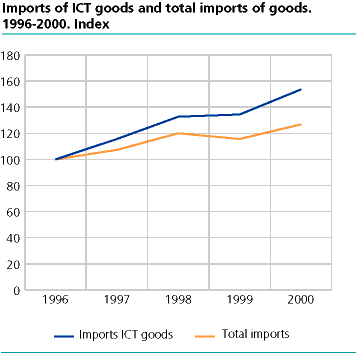
Exports and imports of ICT goods grew faster than the average external trade in the latter half of the 1990s. From 1996 to 2000 Norwegian exports of ICT goods grew by 53.8 per cent in current prices, while imports during the same period increased by 53.6 per cent. From 1996 to 2000 total Norwegian exports, oil and natural gas excluded, grew by 36.5 per cent at the same time as imports rose by 26.8 per cent. Consequently, ICT good's share of total external trade increased slightly. From 1996 to 2000, ICT good's share of total exports increased from 5.8 to 6.6 per cent. During the same period the share of ICT goods in relation to imports increased by 10.1 to 12.2 per cent.
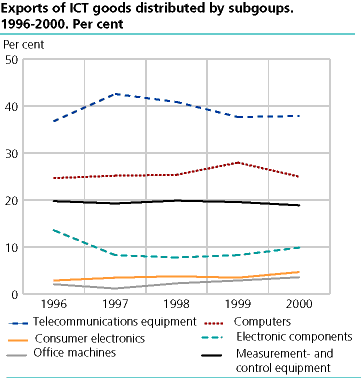
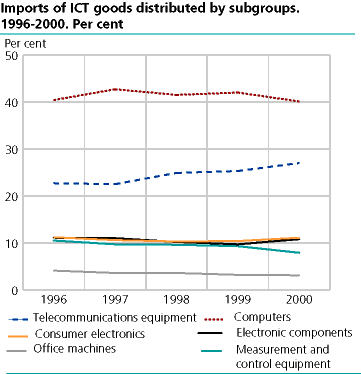
In 2000, telecommunications equipment, computers and measurement- and control equipment were the three top export groups, with NOK 5 276, 3 481 and 2 633 million respectively. Telecommunications equipment accounted for about 38 per cent of the value of ICT exports. In 2000, computers made up the largest import group by far, accounting for NOK 13 746 million or about 40 per cent of the value of ICT imports. In second place was telecommunications equipment, with NOK 9 252 million. From 1996 to 2000 the distribution of the product groups within external trade in ICT goods was relatively stable.
Poor Norwegian exports/imports ratio
The Norwegian external trade with ICT goods showed, with the exception of Iceland, the weakest balance of the Nordic countries. In 2000 both Finland and Sweden achieved an export surplus. In Finland and Sweden the exports/imports ratio was respectively 1.80 and 1.38. Thus, both countries exported more ICT goods than they imported. It is unusual that the exports/imports ratio of ICT goods reaches 1.00 or higher among European nations, but in countries like Japan and South Korea the ratio has traditionally been high.
Different delimitation
This article is based on a delimitation drawn up by the national statistical offices in Denmark, Finland, Iceland, Sweden and Norway. The delimitation is somewhat different than the classification Statistics Norway used to describe the subject in 2000. The delimitation includes the product groups telecommunications equipment, consumer electronics, computers, electronic components, office machines and measurement- and control equipment and are explained in greater detail in "About the statistics."
Tables:
Contact
-
Statistics Norway's Information Centre
E-mail: informasjon@ssb.no
tel.: (+47) 21 09 46 42