Lowest trade surplus in 17 years
Published:
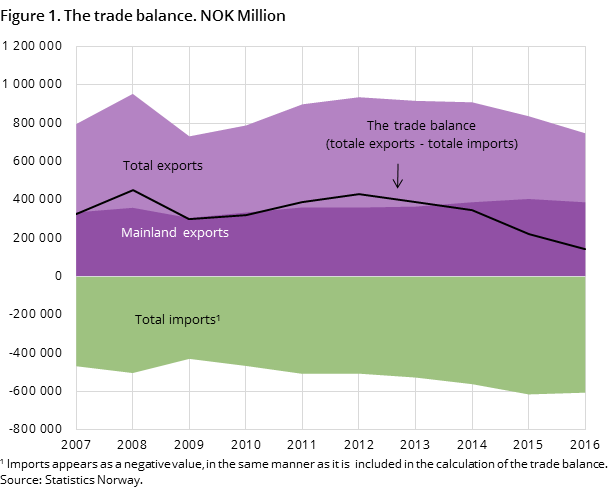
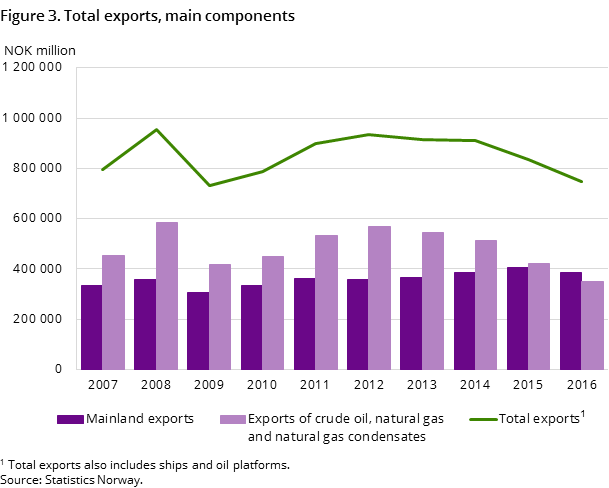
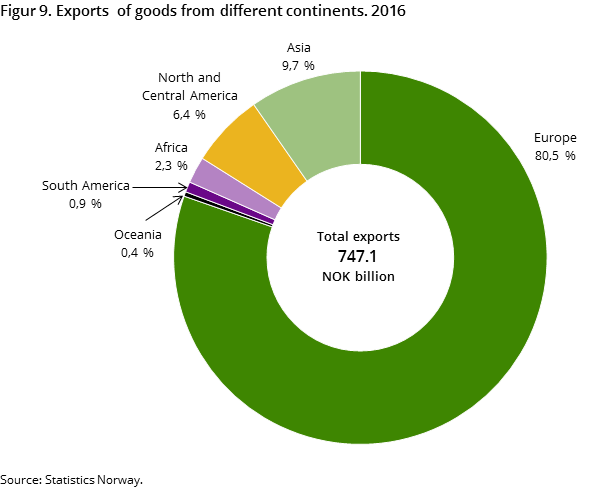
Total exports of goods amounted to NOK 747 billion in 2016 and went down by 10.6 per cent compared to 2015. This was mainly due to lower oil and gas prices and weakened mainland exports. Trade surplus fell by 36.3 per cent and was at the lowest level since 1999.
- Full set of figures
- External trade in goods
- Series archive
- External trade in goods (archive)
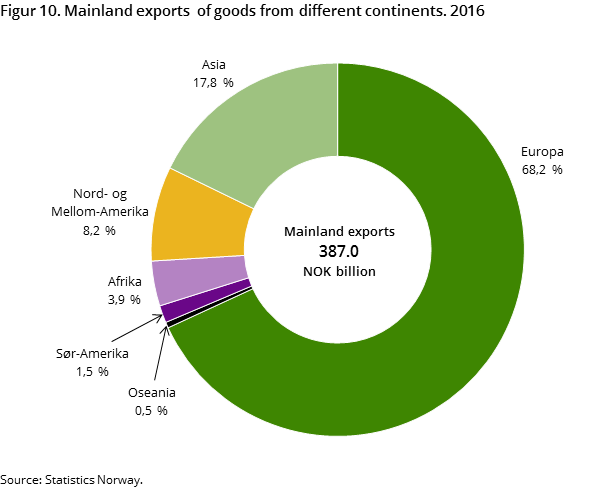
Income from mainland exports went down by 4.3 per cent from 2015, ending at NOK 387.0 in 2016.
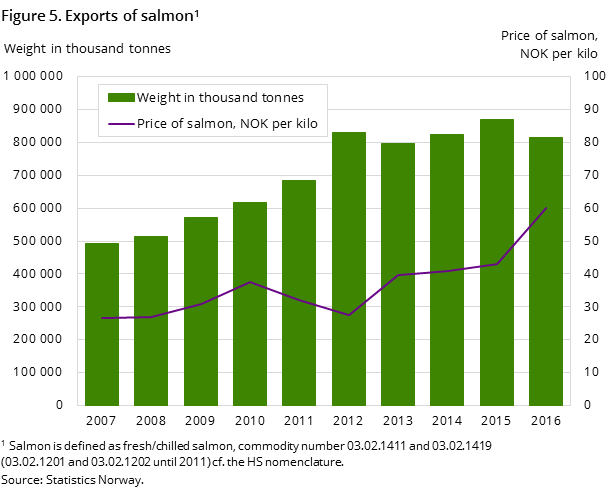
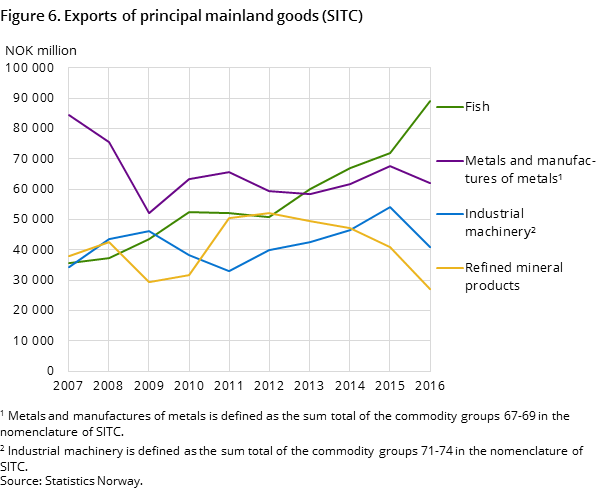
Much of the reduction is due to a fall in exports of industrial machines, where a large proportion goes to oil and gas-related activities abroad. Lower exports of refined petroleum products also contributed. Fish exports pulled in the opposite direction, with prices rising and leading to record high export values in 2016.
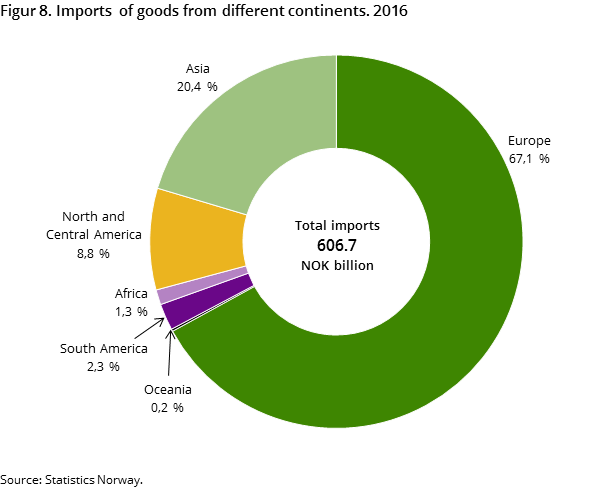
Imports totalled NOK 607 billion and dropped 1.5 per cent from 2015. If trade with oil platforms is excluded, imports increased by 1.5 per cent.
Trade surplus in 2016 ended at NOK 140.4 billion and was further reduced, a decrease of 36.3 per cent compared to 2015.
Lower oil and gas prices
Natural gas exports amounted to NOK 160.2 billion in 2016, which was 27.4 per cent down from 2015. Prices of natural gas in a gaseous state fell by 27.5 per cent, while export volumes were 109.8 billion standard cubic metres, the same level as 2015.
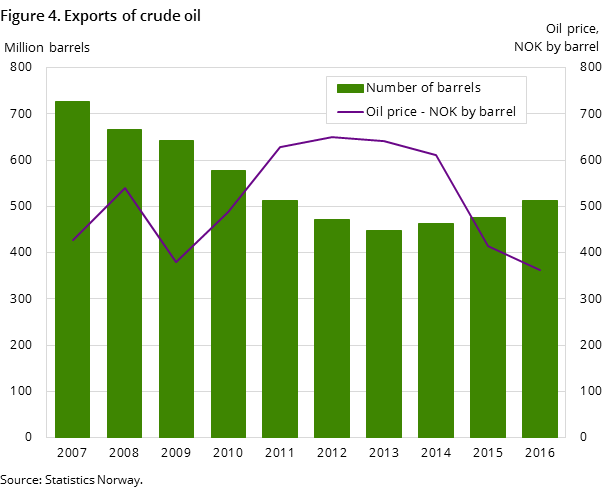
Exports of crude oil dropped by 5.8 per cent and ended at NOK 185.8 billion in 2016. This was due to lower oil prices. The annual average price ended at NOK 363 per barrel and was down 12.4 per cent from 2015. Export volumes rose by 7.5 per cent and reached 512 million barrels in 2016.
Other significant changes
- Exports of industrial machineries amounted to NOK 40.9 billion in 2016 and fell by 24.5 per cent from 2015.
- Exports of refined petroleum products ended at NOK 27.2 billion, which was 33.5 per cent down from 2015.
- Fish exports reached NOK 89.2 billion in 2016, up 23.9 per cent from 2015.
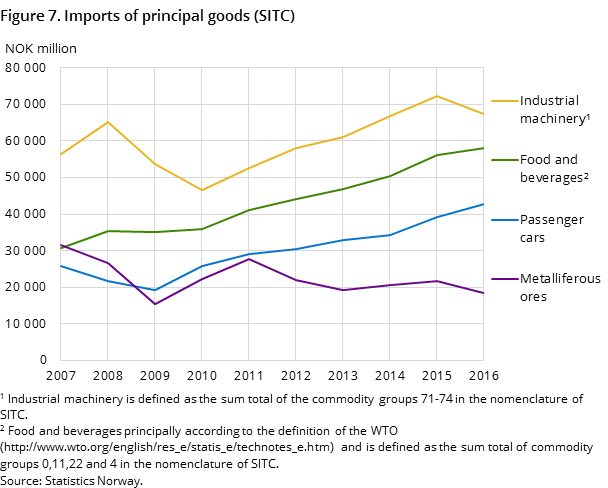
- Imports of road vehicles were NOK 69.3 billion and rose 10.5 per cent compared to 2015.
- Imports of industrial machines totalled NOK 67.5 billion in 2016, which was down 6.6 per cent compared to 2015.
Contact
-
Randi Dyrstad
-
Nina Rolsdorph
-
Øyvind Hagen
-
Statistics Norway's Information Centre

