Completion rate up
Published:
The number of pupils completing upper secondary school and qualifying for university or obtaining vocational competence within five years has increased to 73 per cent over the past two years, up from a previously stable level around 70 per cent.
- Full set of figures
- Completion rates of pupils in upper secondary education
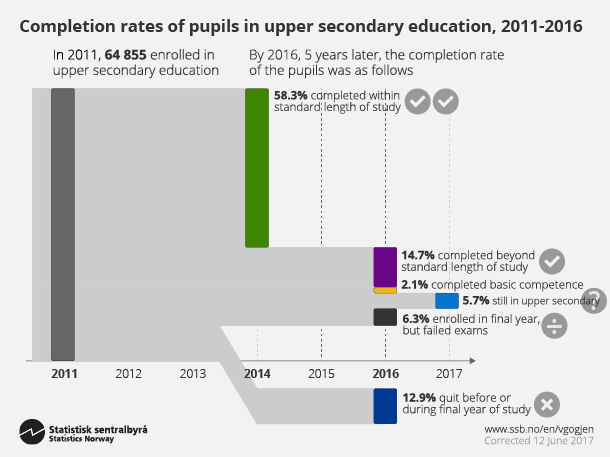
Almost 65 000 pupils started their upper secondary education for the first time in the autumn of 2011, and these are included in the 2016 statistics on completion in upper secondary education. Seventy-three per cent of these pupils completed their upper secondary education and qualified for university or obtained vocational competence within five years. In recent years, the five-year completion rate had been around 70 per cent, until it increased to 72.6 per cent in the 2015 statistics for the cohort starting their upper secondary education in 2010. The figures for 2016 show a continued increase.
Since 2010, various national programmes have been put in place to improve upper secondary completion, notably "Ny GIV" from 2010 to 2013, followed by "Program for bedre gjennomføring i videregående opplæring". but this article does not draw causal conclusions about the effects of such programmes.
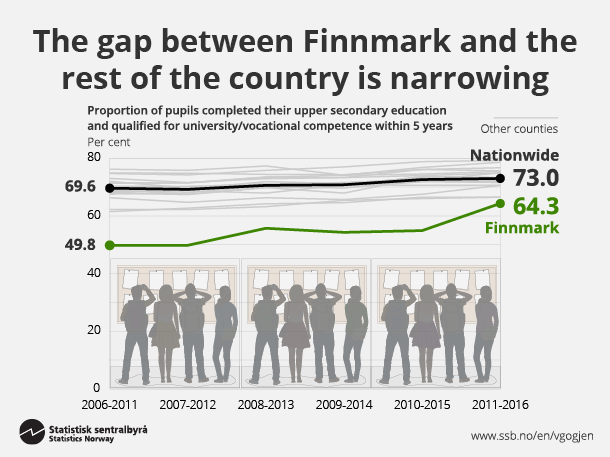
The gap between the northern county of Finnmark and the rest of the country is narrowing
In the period covering the cohorts starting their upper secondary education from 2006 to 2011, completion rates have improved in all counties, but Finnmark has seen a particularly sharp increase, from around 50 per cent for the 2006 cohort to more than 64 per cent for the 2011 cohort.
The increase in Finnmark between the 2010 and 2011 cohorts alone has been more than 9 percentage points. Overall, the completion rate in Finnmark is still well below the national average, but less so for pupils enrolled in general programmes.
Figure 3. Pupils who started in 2011, and the proportion who have completed 2016. By education programmes and gender.
| Completed within standard lenght of study | Completed within five years but beyond standard lenght of study | Completed basic competence | Still in upper secondary education after five years | Enrolled in final year, but failed exams | Quit before or during final year of study | |
| General Both sexes | 75.7 | 10.2 | 1.2 | 2.2 | 6.4 | 4.3 |
| General Males | 71.2 | 10.7 | 1.6 | 2.8 | 8.6 | 5.0 |
| General Females | 79.5 | 9.8 | 0.9 | 1.6 | 4.5 | 3.7 |
| Vocational Both sexes | 39.9 | 19.5 | 3.1 | 9.3 | 6.2 | 22.1 |
| Vocational Males | 33.3 | 22.6 | 3.6 | 10.3 | 6.0 | 24.2 |
| Vocational Females | 48.7 | 15.1 | 2.4 | 8.0 | 6.6 | 19.1 |
Figure 4. General studies. Pupils who started in 2011, and the proportion who have completed 2016.
| Completed within standard lenght of study | Completed within five years but beyond standard lenght of study | Completed basic competence | Still in upper secondary education after five years | Enrolled in final year, but failed exams | Quit before or during final year of study | |
| Specialisation in general studies | 75.6 | 10.3 | 1.3 | 2.1 | 6.4 | 4.2 |
| Sports and physical studies | 76.1 | 10.4 | 0.2 | 2.5 | 7.0 | 3.8 |
| Music, dance and drama | 77.2 | 8.6 | 1.4 | 2.2 | 5.3 | 5.3 |
Figure 5. Vocational studies. Pupils who started in 2011, and the proportion who have completed 2016.
| Completed within standard lenght of study | Completed within five years but beyond standard lenght of study | Completed basic competence | Still in upper secondary education after five years | Enrolled in final year, but failed exams | Quit before or during final year of study | |
| Media and communication | 70.2 | 10.7 | 1.0 | 2.8 | 7.9 | 7.5 |
| Healthcare, childhood and youth development | 47.3 | 15.6 | 3.1 | 8.2 | 7.2 | 18.6 |
| Agriculture, fishing and forestry | 47.5 | 10.4 | 5.9 | 7.7 | 7.1 | 21.5 |
| Design, arts and crafts | 34.1 | 17.7 | 3.1 | 10.4 | 7.9 | 26.9 |
| Technical and industrial production | 37.9 | 16.8 | 3.1 | 11.0 | 3.8 | 27.5 |
| Service and transport | 38.1 | 16.3 | 3.8 | 9.1 | 7.5 | 25.3 |
| Building and construction | 31.7 | 22.3 | 3.7 | 10.5 | 6.1 | 25.7 |
| Restaurant and food | 31.1 | 13.9 | 8.6 | 13.1 | 4.5 | 28.7 |
| Electricity and electronics | 18.9 | 41.2 | 0.5 | 11.9 | 5.3 | 22.3 |
Figure 6. Pupils who started in 2011, and the proportion who have completed 2016. By school points
| Completed within standard lenght of study | Completed within five years but beyond standard lenght of study | Completed basic competence | Still in upper secondary education after five years | Enrolled in final year, but failed exams | Quit before or during final year of study | |
| 10-25 point | 8.9 | 10.7 | 7.4 | 15.2 | 6.2 | 51.7 |
| 25-29 point | 19.2 | 16.4 | 3.6 | 14.2 | 10.0 | 36.6 |
| 30-34 point | 34.3 | 21.6 | 1.3 | 10.7 | 11.8 | 20.3 |
| 35-39 point | 53.5 | 21.4 | 0.2 | 6.1 | 9.1 | 9.7 |
| 40-44 point | 71.8 | 15.3 | 0.1 | 2.6 | 5.5 | 4.7 |
| 45-49 point | 85.1 | 9.3 | 0.0 | 1.2 | 2.3 | 2.1 |
| 50-54 point | 91.3 | 6.3 | 0.0 | 0.4 | 0.9 | 1.1 |
| 55 point or more | 94.4 | 4.3 | 0.0 | 0.3 | 0.2 | 0.8 |
-
More tables and numbers about Completion rates of pupils in upper secondary education
Contact
-
Tom Granseth
-
Kjartan Steffensen
-
Statistics Norway's Information Centre


