Content
Published:
This is an archived release.
Decrease in road traffic fatalities continues
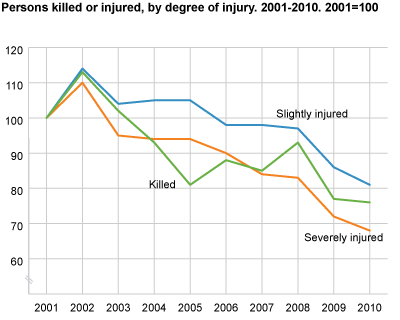
A total of 208 persons were killed in road traffic accidents in 2010; 4 fewer than the year before. Seventy-six per cent of all persons killed were men. More than 50 per cent of all persons killed were car drivers.
A total of 208 persons were killed in 190 fatal accidents in 2010. Of these, 110 were drivers of cars, 39 car passengers, 26 drivers or passengers of motorcycles, 5 were cyclists, 22 pedestrians and 6 were other road users. No moped drivers or passengers were killed in road traffic accidents in 2010.
A total of 9 130 persons were injured in road traffic accidents last year; 714 fewer than in 2009. The average over the period 2001 to 2010 was 250 fatalities and 11 215 injuries per year.
Fewer seriously injured
In 2010, 714 persons were seriously injured in road traffic accidents, compared to 751 in 2009. The average for the 10-year period 2001-2010 was 930.
Most killed in traffic accidents in Nordland and Hordaland
In 2010, 22 persons lost their lives Nordland. Twenty-one persons were killed in road traffic in Hordaland, 18 in Akershus and 17 in Hedmark. In Finnmark, only 3 persons were killed in road traffic accidents.
More car drivers lost their lives
The number of car drivers killed increased from 95 to 110 from 2009 to 2010. The number of car passengers who lost their lives, however, decreased from 48 to 39 in the same period. In 2010, 53 per cent of all persons killed in road traffic accidents were drivers of cars, compared to 45 per cent in 2009. Car drivers and car passengers constituted 72 per cent of all road traffic fatalities in 2010.
Two persons on a light motor cycle were killed in 2010, the lowest number since 2006. The number of persons killed on a heavy motor cycle showed a slight increase, from 19 in 2009 to 24 in 2010. The average for the last 10-year period was 27.
Decrease in bicycle accidents
In all, 5 cyclists were killed in road traffic accidents in 2010 and 557 were injured, compared to 9 killed and 626 injured in 2009. A total of 123 of the killed and injured cyclists in 2010 were children under 15 years of age. During the last 10 years, 9 cyclists have been killed and 699 injured on average per year in road traffic accidents.
Few children lost their lives
Five children under 16 years of age lost their lives in road traffic accidents in 2010, while 781 were injured. Forty-one were seriously injured. This is three fewer killed and 66 fewer injured compared to 2009. The average for the 10-year period 2001-2010 shows 12 persons killed and 1 018 persons injured. Of the five kids that lost their lives last year, two were car passengers, two were cyclists and one was a pedestrian.
Thirty-nine per cent of all persons killed in road traffic last year were between 16 and 34 years of age, compared to 43 per cent in 2009. In total, 81 persons in this age group were killed on Norwegian roads in 2010, compared to 92 in 2009. The number of injured persons was also reduced. A total of 4 036 persons between 16 and 34 years of age were injured in road traffic accidents in 2010. This is a reduction of 371 compared to 2009.
A total of 122 persons lost their lives and 4 289 were injured in the age group 35 years and over, compared to 112 killed and 4 562 injured in 2009.
Head-on-collisions and run-off-the-road accidents
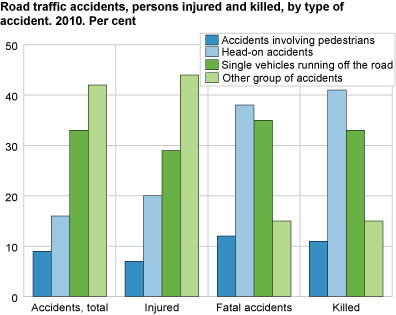
A total of 86 persons were killed in 73 head-on-collision accidents in 2010. Sixty-nine persons were killed in 66 run-off-the-road accidents. Forty-one per cent of all were killed in head-on-collisions. In 2010, 33 per cent were killed in run-off-the road-accidents.
Large consequences of heavy goods vehicle accidents
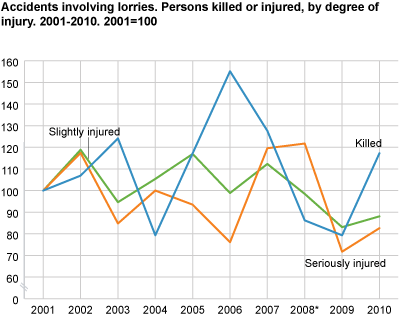
The police registered a total of 243 fatal road traffic accidents involving heavy goods vehicles in 2010. Thirty-five persons were killed in these accidents and 291 injured. The corresponding figures in 2009 were 23 persons killed and 276 injured in 214 accidents involving a heavy goods road vehicle. Twenty-four persons were killed in head-on-collisions, 4 in run-off-the-road-accidents, two were killed in connection with crossing roads, two pedestrians were killed when crossing lanes and two of those killed were in the group other accidents.
Over 14 per cent of the accidents involving a heavy goods road vehicle in 2010 were fatal, compared to 3 per cent of all road traffic accidents.
Most severe accidents outside densely populated areas
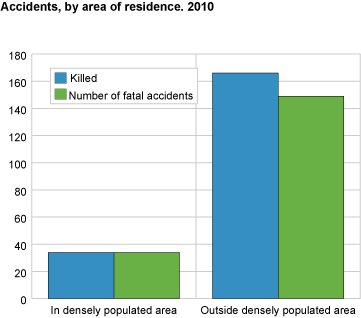
A total of 208 persons were killed in road traffic accidents in 2010. A total of 166 persons, corresponding to 80 per cent, lost their lives in accidents outside densely populated areas. There were 149 fatal accidents outside densely populated areas, corresponding to 78 per cent of all fatal accidents.
Thirty-four persons were killed in accidents within densely populated areas; 14 pedestrians, 11 car driver, 1 passenger, 2 motorcyclists, 3 cyclists and 3 in the group other road users.
Police figuresThe statistics are based on accidents reported to the police. Less severe accidents and injuries are often not reported to the police, and may therefore be underrepresented in the figures. The total number of injuries includes casualties where the degree of injury has not been specified. Around 12 per cent of the casualties reported in 2010 belonged to this category. Some people registered in this category may be uninjured, and figures are subject to change. |
Tables:
- Table 1 Persons killed or injured in road traffic accidents, by group of road-user and month. 2001-2010
- Table 2 Persons killed or injured, by group of road-user and degree of injury. 2001-2010
- Table 3 Persons killed or injured, by group of road-user and sex. 2001-2010
- Table 4 Persons killed or injured, by age group and degree of injury. 2001-2010
- Table 5 People killed or injured in road traffic accidents, by degree of injury, sex and age. 2010
- Table 6 Persons killed or injured, by group of road user and age. 2010
- Table 7 People killed or injured, by group of road user. County. 2010
- Table 8 Persons killed or injured, by group of road user and police district. 2010
- Table 9 Persons killed or injured, by age. County. 2010
- Table 10 Persons killed or injured, by age. Police district. 2010
- Table 11 People killed or injured in road traffic accidents, by group of road user and accident type. 2010
- Table 12 Accidents involving lorries. Number of traffic units involved and persons killed or injured. 2007-2010
- Table 13 Accidents involving lorries. Persons killed or injured, by type of accident. 2007-2010
- Table 14 Persons killed in road traffic accidents in the Nordic countries per 100 000 of the population. 2000-2010
- Table 15 Persons killed in road traffic accidents, by group of road user. 1970-2010
- Table 16 Persons killed or injured in road traffic accidents, exposure data. 1970-2010
- Table 17 People killed in road traffic accidents, by accident type 1977-2010
- Table 18 Persons killed or injured in road traffic accidents, by road user, area of residence og type of accident. 2010
The statistics is published with Road traffic accidents involving personal injury.
Contact
-
Statistics Norway's Information Centre
E-mail: informasjon@ssb.no
tel.: (+47) 21 09 46 42


