Content
Published:
This is an archived release.
Fewer people injured in 2008
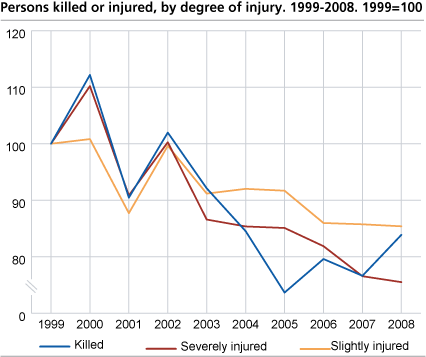
255 people were killed in road traffic accidents in 2008, 22 more than in the year before. 195 of them were men. The number of injuries dropped significantly from 2007 to 2008.
The fatalities included 123 vehicle drivers, 46 passengers, 32 motorcyclists, five moped riders, ten cyclists, 31 pedestrians and eight other road users. In terms of absolute figures, vehicle drivers saw the largest increase in fatalities from 2007 to 2008 with 13 more people killed.
10 868 people were injured in road traffic accidents last year, 1 214 fewer than in 2007. The difference is statistically significant. The average over the period 1998 to 2007 was 282 fatalities and 11 755 injuries per year. Even if the fatality- and injury figures have varied from one year to the next, the trend line for the last ten years in downward sloping.
Geographic distribution
Møre and Romsdal county saw the highest increase in road traffic fatalities both in terms of absolute and relative figures. 24 people lost their lives in the county in 2008, compared to five in 2007. The 2007-figure was, however, lower than usual: In the period from 1997 to 2006, an average of 17 people were killed each year.
Up 15 per cent from the previous year, Sør-Trøndelag county experienced the largest increase in road traffic injuries from 2007 to 2008. The decrease in injury figures was highest in Møre and Romsdal. 596 people were injured in traffic accidents in 2008, compared to 770 the year before, a 23 per cent decrease.
More young people killed on the road
61 people, twelve girls and 49 boys, aged 18 to 24, were killed on norwegian roads in 2008. The corresponding figure for 2007 was 35. 38 of those who were killed were vehicle drivers, and ten were passengers. Young people in this age group accounted for 24 per cent of road traffic fatalities in 2008.
More run-off-the-road accidents
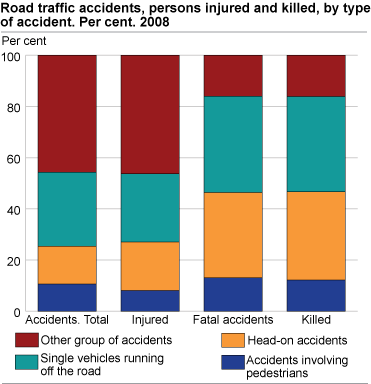
Around 29 per cent of all road traffic accidents in 2008 were run-off-the-road accidents. It was the accident type that most frequently had the most serious consequences: 38 per cent of the fatal accidents were run-off-the-road accidents, up six percentage points from 2007, when head-on collisions dominated with a share of 42 per cent of the fatal accidents. Off-the-road accidents claimed 72 and 95 lives in 2007 and 2008, respectively. Head-on collisions accounted for 15 per cent of the total number of accidents, and 33 per cent of the fatal accidents that occurred in 2008. 88 people were killed in such accidents.
Special topic: Heavy goods vehicles and road traffic safety
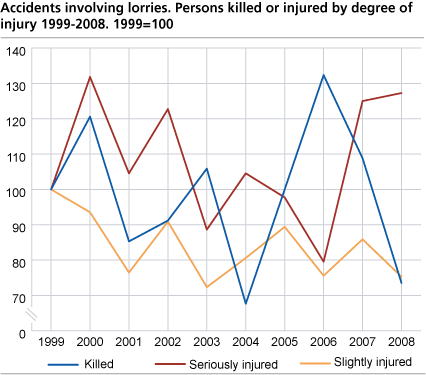
25 people were killed in accidents involving heavy goods vehicles in 2008, compared with 37 in 2007. The fatalities included 19 drivers, four passengers and two motor cyclists. Seven of the people who were killed were drivers or passengers of heavy goods vehicles. The others were drivers or passengers of smaller vehicles. 342 people were injured in accidents involving heavy goods vehicles in 2008. 56 of them were severely injured. The corresponding figure for 2007 was 411 injuries, of which 55 were severe.
The police registered a total of 237 fatal road traffic accidents in 2008. Heavy goods vehicles were involved in almost ten per cent of these accidents. Accidents involving heavy goods vehicles had fatal outcomes more often than did other accidents: Nine per cent of accidents involving heavy goods vehicles left at least one person dead, compared to three per cent of other accidents. The difference is still pronounced when we look at figures for more years, and it is statistically significant. In the period from 1998 to 2007, eleven per cent of accidents involving heavy goods had a fatal outcome, compared to three per cent of other road traffic accidents.
Weight and speed play an important part
It is easy to understand why this is so. 70 per cent of the traffic accidents in 2008 that involved heavy goods vehicles were some type of collision (category A to E in table 11). The outcome of a collision will among other things depend on the weight and speed of the vehicles involved. The higher the weight of the approaching vehicles, the more severe the consequences will be in case of a collision. This explains why traffic accidents involving heavy goods vehicles have a higher rate of fatal outcomes than do other accidents. Observe, however, that the number of accidents involving heavy goods vehicles is small compared to the total number of accidents. Hence, random variations in accident figures will have a larger impact on the ratio of fatal accidents to accidents as a whole for this group.
Risk is lower
Heavy goods vehicles are often used for commercial purposes, and usually cover a longer distance per year than do other types of vehicles. When considering risk it is therefore interesting to take a closer look at the accident figures relative to the distances the different vehicle types travel each year. Heavy goods vehicles traveled 919 million vehicle kilometers in 2008. The rest of the car fleet covered 37 929 million vehicle kilometers during the same period of time. A total of 262 heavy goods vehicles were involved in road traffic accidents, compared to 11 818 other motorized vehicles. Dividing the number of vehicles involved by the distance traveled gives 2.85 and 3.12 vehicles involved per ten million vehicle kilometers traveled, respectively. This means that heavy goods vehicles are involved in road traffic accidents less often than other types of vehicles. At the same time, accident figures also show that the consequences frequently are more severe when a heavy goods vehicle is involved.
Vehicles involved per ten million vehicle kilometers traveled, respectively. This means that heavy goods vehicles are involved in road traffic accidents less often than other types of vehicles. At the same time, accident figures also show that the consequences frequently are more severe when a heavy goods vehicle is involved.
Police figures
The statistics are based on accidents reported to the police. Less severe accidents and injuries are often not reported to the police, and may therefore be underrepresented in the figures. The total number of injuries includes casualties where the degree of injury has not been specified. Around eleven per cent of the casualties reported in 2008 belonged to this category. Some people registered in this category may be uninjured, and figures are subject to change.
Tables:
- Table 1 Persons killed or injured in road traffic accidents, by group of road-user and month 1999-2008
- Table 2 Persons killed or injured, by group of road-user and degree of injury
- Table 3 Persons killed or injured, by group of road-user and sex. 1998-2007
- Table 4 Persons killed or injured, by age group and degree of injury. 1999-2008
- Table 5 People killed or injured in road traffic accidents, by degree of injury, sex and age. 2008
- Table 6 Persons killed or injured, by group of road user and age. 2008
- Table 7 People killed or injured, by group of road user and county. 2008
- Table 8 Persons killed or injured, by group of road user and police district. 2008
- Table 9 Persons killed or injured, by age and county. 2008
- Table 10 Persons killed or injured, by age and police district. 2008
- Table 11 People killed or injured in road traffic accidents, by group of road user and accident type. 2008
- Table 12 Accidents involving lorries. Number of traffic units involved and persons killed or injured. 2005-2008
- Table 13 Accidents involving lorries. Persons killed or injured, by type of accident. 2005-2008
- Table 14 Persons killed in road traffic accidents in the Nordic countries per 100 000 of the population. 1999-2008
- Table 15 Persons killed in road traffic accidents, by group of road user. 1970-2008
- Table 16 Persons killed or injured in road traffic accidents, exposure data. 1970-2008
- Table 17 People killed in road traffic accidents, by accident type 1977-2008
The statistics is published with Road traffic accidents involving personal injury.
Contact
-
Statistics Norway's Information Centre
E-mail: informasjon@ssb.no
tel.: (+47) 21 09 46 42


