Content
Published:
This is an archived release.
Fewer accidents on Norwegian roads in 2001
A total of 8 244 road traffic accidents were reported to the police in 2001. 275 persons lost their lives and 11 522 were injured in these accidents. This is 66 fewer fatalities and 140 fewer injuries than in 2000.
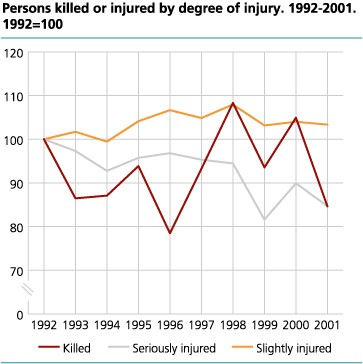
Of the 11 522 persons injured in traffic accidents last year, 1 043 were dangerously or seriously injured while 9 046 were slightly injured. The average figures for the ten-year period 1992-2001 show 302 killed, 1 306 dangerously or seriously injured and 10 350 slightly injured.
Fewer bicycle accidents
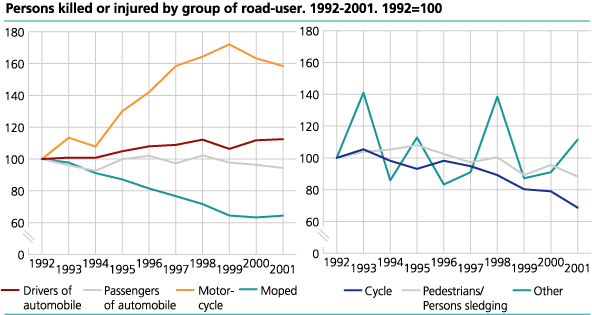
Six cyclists were killed and 697 injured in 2001, compared with 13 killed and 795 injured in 2000. In the last ten-year period the average number of killed and injured cyclists has been reduced by 31 per cent.
The number of killed and injured pedestrians also decreased in 2001, compared with the previous year. 47 pedestrians were killed and 951 injured in 2000, while 43 pedestrians were killed and 877 injured in 2001. On a yearly basis, an average of 44 pedestrians have been killed and 976 injured in the ten-year period 1992-2001.
Fewer drivers of motorcycles killed
Last year, 28 drivers of motorcycles were killed and 693 injured. This is 12 fewer casualties compared with 2000, and four more casualties than the average figure for the period 1992-2001. The number of injuries among drivers of motorcycles was about the same as previous years.
Fewer children died in traffic
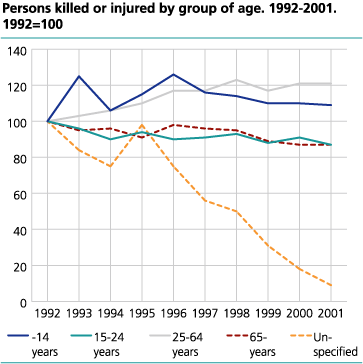
Seven children under the age of 15 lost their lives and 957 were injured in Norwegian traffic in 2001. This is 13 fewer casualties and about the same number of injuries as in 2000. The average figures for the period 1992-2001 show 18 casualties and 984 injuries in this age group. Of the seven children that were killed in road traffic accidents last year, two were passengers of automobiles, four were pedestrians and one was sledging.
Many casualties in the age group 15-30 years
Most of the casualties last year came in the age groups 20-24, 15-19 and 25-29 years, with 37, 32 and 29 persons killed, respectively. In other words, close to 36 per cent of the people killed in road traffic accidents last year were between 15 and 30 years old. At the same time, this is the age group that experienced the largest decrease in casualties between 2000 and 2001.
The number of injures also decreased in the age group 15-30 years, from 4 847 persons injured in 2000 to 4 558 persons injured in 2001.
Increase in casualties among 75 to 79 year olds
The number of casualties in the age group 75-79 years increased more than similar figures for any other age group between 2000 and 2001. A total of 25 persons were killed and 267 injured in this age group last year, compared with 15 persons killed and 236 injured in 2000. Ten of the persons killed in this age group were drivers of automobiles, six more than the previous year. Of the other casualties in this age group in 2001, four were passengers of automobiles, one was a driver of a motorcycle, one was a driver of a moped, one was a cyclist and eight were pedestrians.
In the age groups from 80 years and up, a total of 17 persons were killed last year, eight fewer than in 2000.
More accidents in Hordaland
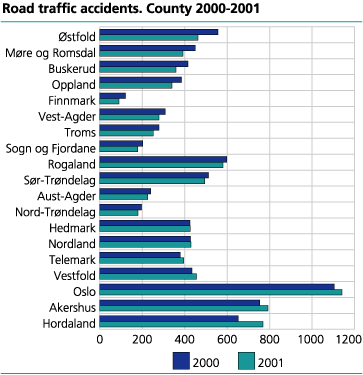
The number of accidents fell the most in Østfold, Møre og Romsdal and Buskerud counties in 2001, with 94, 58 and 57 fewer accidents than in 2000, respectively. The counties of Hordaland, Akershus and Oslo increased the most with 117, 38 and 37 more accidents than in 2000.
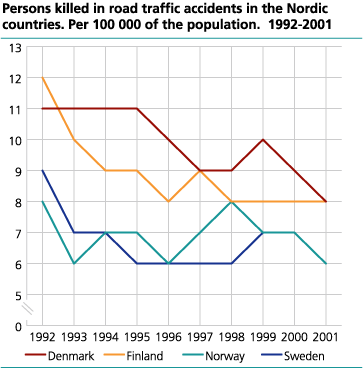
Road traffic accidents in Nordic countries
According to preliminary figures from Statistics Denmark there were 6 873 accidents on Danish roads in 2001. A total of 424 persons were killed and 8 422 injured in these accidents.
Preliminary figures from Statistics Finland show 6 452 accidents in Finish roads in 2001, with a total of 431 persons killed and 8 414 injured.
The Swedish National Road Administration has estimated that 565 persons were killed on Swedish roads in 2001. Figures for number of accidents and injuries in Sweden are presented later this year.
Relatively high number of accidents in Norway
In proportion to the size of the population, Norway has a high number of road traffic accidents and injuries - but somewhat fewer casualties - compared with Denmark and Finland. Comparative figures show that Norway had 261 accidents, 255 injuries and six casualties per 100 000 inhabitants in 2001.
Similar figures for Denmark show 165 road traffic accidents, 157 injuries and eight casualties, while Finland had 170 accidents, 162 injuries and eight casualties per 100 000 inhabitants in 2001. The estimate for Sweden show six casualties per 100 000 inhabitants in 2001.
More information: aud-marit.beck@ssb.no , tel. +47 62 88 54 20, or asbjorn.willy.wethal@ssb.no , tel. +47 62 88 54 15.
Tables:
- Table 1 Persons killed or injured in road traffic accidents, by group of road-user. 1992-2001
- Table 2 Persons killed or injured, by road-user and degree of injury. 1992-2001
- Table 3 Persons killed or injured, by road-user and sex. 1992-2001
- Table 4 Persons killed or injured, by group of age. 1992-2001
- Table 5 Persons killed or injured, by road-user and age. 2001
- Table 6 Persons killed or injured, by road-user, police district and county. 2001
- Table 7 Persons killed or injured, by age, police district and county. 2001
- Table 8 Cyclists killed or injured, by age, sex and protection. 2001
- Table 9 Cyclists, by degree of injury and protection. 2001
- Table 10 Persons killed or injured in road traffic accidents, by group of road-user, type of residential area and group of accidents. 2001
- Table 11 Persons killed or injured in road traffic accidents in the Nordic countries. 1992-2001
The statistics is published with Road traffic accidents involving personal injury.
Contact
-
Statistics Norway's Information Centre
E-mail: informasjon@ssb.no
tel.: (+47) 21 09 46 42

