Content
Published:
This is an archived release.
Offshore secured growth
1 685 local kind-of-activity units (KAU) in water transport generated NOK 35.1 billion of value added in 2006, an increase of 10.4 per cent from 2005. The number of employed persons in the industry was 23 754 in 2006, a growth of 3.7 per cent from the year before.
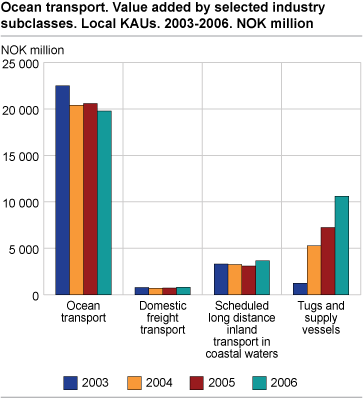
In 20041 ocean transport represented 68 per cent of the total value added within sea and coastal water transport, while tugs and supply vessels made up 18 per cent. In 2006 the equivalent shares were 56 and 30 per cent respectively.
Considerable value added in offshore
Value added fell by NOK 0.8 billion between 2005 and 2006 for ocean transport, while tugs and supply vessels increased its value added by NOK 3.4 billion.
Record margins in offshore
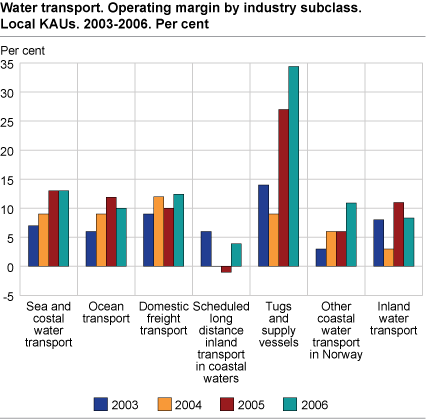
Tugs and supply vessels had a record breaking operating margin in 2006. Sea and coastal water transport had a total operating margin of 12.9 per cent, mostly due to the 34.4 per cent from tugs and supply vessels. Ocean transport saw the operating margin falling from 11.9 per cent in 2005 to 9.6 per cent in 2006. Operating margins in domestic freight transport and scheduled long distance inland transport also went up. In domestic freight transport the margin went from 9.7 per cent in 2005 to 12.4 in 2006. Scheduled long distance inland transport had a negative operating margin of -1.4 in 2005, but turned this around to a positive 3.4 per cent in 2006.
Investments
The bulk of the investments in sea and coastal water transport industry took place in ocean transport. While the total gross investment for sea and coastal water transport was NOK 17.6 billion, ocean transport invested NOK 12.3 billion. Tugs and supply vessels had a gross investment of NOK 4.2 billion.
Statistics on the enterprise levelThe structural business statistics for air transport are compiled both on the local KAU level and on the enterprise level. Figures on the enterprise level will usually deviate from figures on the local KAU level. This is due to the fact that the enterprises are registered in the industry subclass that comprises the main part of the activity of the enterprise, and therefore may be registered in a different industry than some of the local KAUs. Revision of industriesIn 2007, the enterprises in Statistic Norway’s Central Register of Establishments and Enterprises have been coded in accordance with the new Standard Industrial Classification (SN2007). This has revealed some incorrectly classified enterprises and local KAUs. In such cases, the code according to the current standard (SN2002) has been revised. The impact for sea and coastal water transport has been minor. |
1Before 2004 enterprises with tugs and supply vessels operating in foreign waters were put in the industry sub class of ocean transport. Beginning in 2004 all these enterprises were placed in the industry sub class of tugs and supply vessels.
Tables:
- Table 1 Sea and coastal water transport. Principal figures, by industry subclass. Local kind-of-activity units. 2003-2006
- Table 2 Sea and Coastal water transport. Principal figures, by number of persons employed and industry group. Local kind-of-activity units. 2006
- Table 3 Water transport (NACE 61 ). Principal figures, by county. Local kind-of-activity units. 2004-2006
- Table 4 Sea and coastal water transport. Principal figures, by industry subclass.Enterprises. 2003-2006
- Table 5 Sea and Coastal water transport. Principal figures, by number of persons employed and industry group. Enterprises. 2006
- Table 6 Sea and coastal water transport excluding ocean transport. Turnover specified by type of service. Enterprise. 2002-2006
The statistics is now published as Business statistics.
Contact
-
Statistics Norway's Information Centre
E-mail: informasjon@ssb.no
tel.: (+47) 21 09 46 42


