Content
Published:
This is an archived release.
Solid growth in tugs and supply vessels
1 656 enterprises in water transport had a turnover of NOK 117.2 billion and employed 22 994 people in 2005. Ocean transport made up 83.5 per cent of the turnover and 42.1 per cent of the employment.
Turnover
Compared with 2004, turnover in water transport rose by 9.1 per cent. Scheduled domestic transport, which includes passenger transport along the coast, saw turnover fall by 5.5 per cent, while ocean transport and tugs and supply vessels had a joint increase in turnover by 9.7 per cent. Domestic freight transport experienced an increase in turnover of 10.0 per cent.
Tugs and supply vessels
This industry sub class includes vessels offshore and supply activities. It had an increased turnover of 29.2 per cent compared with 2004. The majority of the increase came from enterprises that were involved in the industry in both 2004 and 2005. Approximately one third of the increase, however, is due to enterprises new to the industry sub class. Please note that some enterprises in this industry sub class previously where located in ocean transport. Starting in 2004, all offshore supply activity is located in this industry sub class.
Profitability
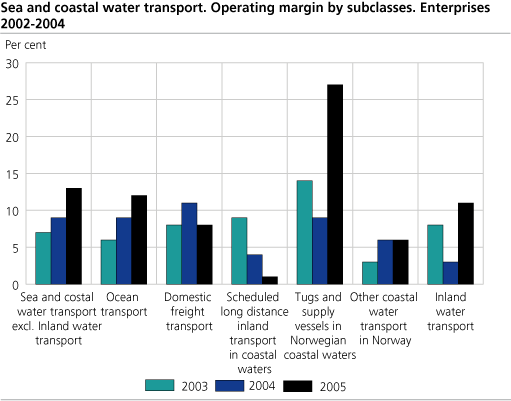
The increase in profitability in ocean transport and in tugs and supply in 2004 continued in 2005. Joint profitability margins in the two industry sub classes were 6.5, 9.3, and 13.5 per cent in 2003, 2004, and 2005 respectively. While ocean transport had the largest increase in profitability margin in 2004, tugs and supply had the largest increase in 2005. The profitability margins of the two industry sub classes were more or less equal in 2004 at 9.3 per cent. In 2005, however, ocean transport increased its margin to 11.9 per cent and tugs and supply to 26.6 per cent. Profitability margins in domestic freight transport and scheduled domestic transport both fell by about 3 percentage points to 8.0 per cent and 0.6 per cent respectively
Investments
The highest gross investments were found in tugs and supply with NOK 4.6 billion. Ocean transport’s level of gross investments was NOK 2.0 billion.
Local kind-of-activity units
1 681 local KAUs were operating within sea and coastal water transport in 2005. Figures on enterprise level will usually deviate somewhat from figures compiled on local KAU level. This is due to the fact that the enterprises are registered in the industry sub class that comprises the main part of the activity of the enterprise, and therefore may be registered in a different industry than some of the local KAUs. For more information on KAUs and enterprises, see “About the statistics” All the figures in this article are based on enterprises.
Tables:
- Table 1 Sea and coastal water transport. Principal figures, by industry subclass. Local kind-of-activity units. 2001-2005
- Table 2 Sea and Coastal water transport. Principal figures, by number of persons employed and industry group. Local kind-of-activity units. 2005
- Table 3 Water transport (NACE 61 ). Principal figures, by county. Local kind-of-activity units. 2003-2005
- Table 4 Sea and coastal water transport. Principal figures, by industry subclass.Enterprises. 2002-2005
- Table 5 Sea and Coastal water transport. Principal figures, by number of persons employed and industry group. Enterprises. 2005
- Table 6 Sea and coastal water transport excluding ocean transport. Turnover specified by type of service. Enterprise. 2002-2005
The statistics is now published as Business statistics.
Contact
-
Statistics Norway's Information Centre
E-mail: informasjon@ssb.no
tel.: (+47) 21 09 46 42

