Content
Published:
This is an archived release.
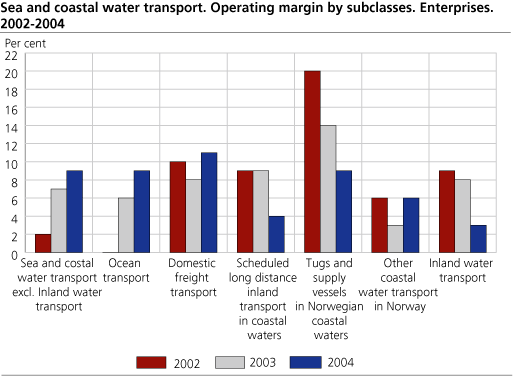
Strong operating margin in ocean transport
Ocean transport had a turnover of NOK 91 billion in 2004, an increase of 8.0 per cent from the previous year. The operating margin for this sub group came to a solid 9.3 per cent.
In total there were 1649 enterprises within sea and coastal water transport in 2004 with a turnover of NOK 107.5 billion. The sector employed 22 576 persons last year.
Rise in turnover
Compared to 2003 the turnover in sea and coastal transport increased by 7.4 per cent. Domestic freight transport, which includes tramp and scheduled freight lines, had a reduction in turnover at 6.6 per cent. Ocean transport and tugs and supply vessels saw a collective increase in turnover at 8.0 per cent compared to 2003. Scheduled long distance inland transport in coastal waters experienced a stable turnover with a slight increase of 0.9 per cent from 2003.
Increased profitability
Ocean transport and tugs and supply vessels combined had a strong improvement in operating margin. The operating margin went from 6.5 per cent in 2003 to 9.3 per cent in 2004. Operating income increased by 8.7 per cent while operating costs increased by the smaller 5.5 per cent. The strong improvement in this group of industry subclasses is for the most part due to ocean transport. Ocean transport saw a slight increase in operating income, up 0.8 per cent from 2003, while operating costs fell by 2.3 per cent from 2003. The change in industry classification must be considered when looking at ocean transport and tugs and supply vessels in isolation. Operating margin in the industry subclass of domestic freight transport is back to the level of 2002. The margin was at 10 per cent in 2002, took a fall in 2003 to 7.8 per cent, and was in 2004 at 10.6 per cent. Scheduled long distance inland transport in coastal waters experienced a sharp drop in operating margin, from 8.9 per cent in 2003 to 3.7 per cent in 2004 due to a stable turnover combined with increased operating costs.
Investments
A combined NOK 1.4 billion increase in gross investments in tugs and supply vessels must be considered in light of the change in industry classification. 68 enterprises were reclassified from ocean transport to tugs and supply vessels. The two industry subclasses had a combined increase in gross investments of 1.1 per cent which is 93.5 per cent of gross investments within sea and coastal water transport.
Changes in industry classification
Starting in 2004 there has been a change in the industry classification concerning the treatment of enterprises within offshore supply. Some enterprises in this industry were previously treated as ocean transport in our statistics. Due to increased activity in the industry (and the need to distinguish between ocean transport and supply activities on the continental shelf) it was determined that all enterprises that operates in offshore supply were to be treated along with the industry subclass tugs and supply vessels. See also “About the statistics”.
Employment
Starting in 2004 the methods for gathering and estimating employment were changed. Employment figures are now collected directly through the Registrar of Employers and Employees (Arbeidsgiver- og Arbeidstakerregistret, a.k.a. AA-registret). The change makes it difficult to compare employment-figures over time. For more on this change, see “About the statistics”.
Local kind-of-activity units
1 649 local KAUs were operating within sea and coastal water transport in 2004. Figures on the enterprise level will usually deviate somewhat from figures compiled on the local KAU level. This is due to the fact that the enterprises are registered in the industry subclass that comprises the main part of the activity of the enterprise, and therefore may be registered in a different industry than some of the local KAUs. For more on KAUs and enterprises, see “About the statistics” All the figures in this article are based on enterprises.
Tables:
- Table 1 Sea and coastal water transport. Principal figures, by industry subclass. Local kind-of-activity units. 2002-2004
- Table 2 Sea and Coastal water transport. Principal figures, by number of persons employed and industry group. Local kind-of-activity units. 2004
- Table 3 Water transport (NACE 61 ). Principal figures, by county. Local kind-of-activity units. 2002-2004
- Table 4 Sea and coastal water transport. Principal figures, by industry subclass. Enterprises. 2002-2004
- Table 5 Sea and Coastal water transport. Principal figures, by number of persons employed and industry group. Enterprises. 2004 (Corrected 4 July 2006 at 1300)
- Table 6 Sea and coastal water transport excluding ocean transport. Turnover specified by type of service. Enterprise. 2002-2004
The statistics is now published as Business statistics.
Contact
-
Statistics Norway's Information Centre
E-mail: informasjon@ssb.no
tel.: (+47) 21 09 46 42

