Content
Published:
This is an archived release.
Steady turnover in water transport
1 657 enterprises within sea and coastal water transport had a turnover of NOK 100.1 billion and employed 23 412 people, of this ocean transport accounted for NOK 90.8 billion and 13 856 people.
Turnover
Compared with 2002 ocean transport increased turnover by 3 per cent. Scheduled long distance inland transport in coastal waters increased turnover by 4.4 per cent, while tugs and supply vessels in Norwegian coastal waters had a decrease of 6.8 per cent.
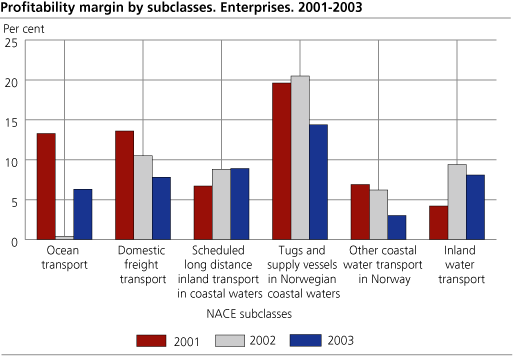
Profitability
Ocean transport increased its operating margin from 0.4 per cent in 2002 to 6.3 per cent in 2003 due to an increase in operating income increasing of 2.8 per cent and a decrease in operating costs of 3.3 per cent. Operating margin within tugs and supply vessels in Norwegian coastal waters declined from 20.5 per cent in 2002 to 14.4 per cent in 2003 due to a greater fall in operating income than in operating costs. Operating margin for scheduled long distance inland transport in coastal waters increased fairly from last year, ending at 8.9 per cent.
Investments
Totally there were invested NOK 9.6 billion within sea and coastal water transport, an increase compared with 2002 where investments were equal of NOK 940 million. Of the total investments, ocean transport account for NOK 8.6 billion or 89 per cent.
Local KAUs
1 674 Local KAUs and were operating within sea and coastal water transport in 2003. Figures on the enterprise level will usually deviate somewhat from figures compiled on the local KAU level. This is due to the fact that the enterprises are registered in the industry subclass that comprises the main part of the activity of the enterprise, and therefore may be registered in a different industry than some of the local KAUs.
During 2003 some companies have changed industry group, which makes it difficult to compare 2002 and 2003. This concerns subclasses ocean transport and domestic freight transport.
More figures in StatBank.
Tables:
- Table 1 Sea and coastal water transport. Principal figures, by industry subclass. Local kind-of-activity units. 2001-2003
- Table 2 Sea and Coastal water transport. Principal figures, by number of persons employed and industry group. Local kind-of-activity units. 2003
- Table 3 Water transport (NACE 61 ). Principal figures, by county. Local kind-of-activity units. 2002-2003
- Table 4 Sea and coastal water transport. Principal figures, by industry subclass. Enterprises. 2001-2003
- Table 5 Sea and Coastal water transport. Principal figures, by number of persons employed and industry group. Enterprises. 2003
- Table 6 Sea transport. Turnover specified by type of service. Enterprise
The statistics is now published as Business statistics.
Contact
-
Statistics Norway's Information Centre
E-mail: informasjon@ssb.no
tel.: (+47) 21 09 46 42

