Content
Published:
This is an archived release.
Experience tourism ever more popular
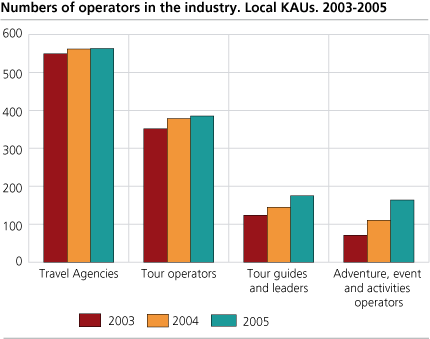
In 2005 more than 50 new adventure, event and activities operators were established. This is an increase of 48 per cent from 2004. The number of tour guides and leaders also increased significantly from 2004 to 2005.
In 2005 the adventure, event and activity operators had a total of NOK 489 million in operating income, which is an increase of 8 per cent from 2004. Although the income increased, the operating margin was small. In 2005 the operating result was NOK 1.8 million, which equals a 0.4 per cent operating margin1.
Increased profitability
In the industry as a whole, the operating margin increased from 1.2 per cent in 2004 to 1.9 per cent in 2005. This is mainly due to increases in the operating margin for the biggest subgroups tour operators and travel agencies. Tour guides and leaders had an operating margin of 7.5 per cent, which is the largest of the subgroups. The industry’s value-added also increased from 2004. In 2005, the value-added was NOK 2.5 billion, which is an increase of 5.7 per cent from the previous year.
Business structure
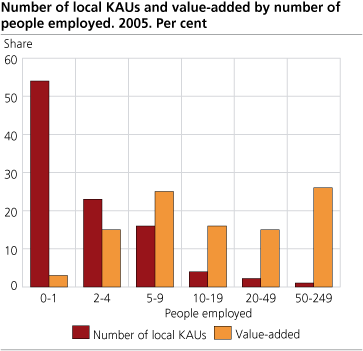
Three out of four of the local KAUs had an employment of 4 people or less. In 2005 this group had a value-added of NOK 466 million and an employment of 1 359. Only 48 of the local KAUs had more than 20 employees, but they had a 41 per cent share of the industry’s value-added and a 36 per cent share of the employment.
Local KAUs and enterprises
Figures on the enterprise level will usually deviate from figures on the local KAU level. This is due to the fact that the enterprises are registered in the industry subclass that comprises the main part of the activity of the enterprise, and therefore may be registered in a different industry than some of the local KAUs.
Tables:
- Table 1 Activities of travel agencies, tourist offices and tour operators. Main figures, by industry subclass. Local kind-of-activity units. 2003-2005
- Table 2 Activities of travel agencies, tourist offices and tour operators. Main figures, by number of people employed and industry group. Local kind-of-activity units. 2005
- Table 3 Activities of travel agencies, tourist offices and tour operators. Main figures, by industry subclass. Enterprises. 2003-2005
- Table 4 Activities of travel agencies, tourist offices and tour operators. Main figures, by number of people employed and industry group. Enterprises. 2005
The statistics is now published as Business statistics.
Contact
-
Statistics Norway's Information Centre
E-mail: informasjon@ssb.no
tel.: (+47) 21 09 46 42


