Content
Published:
This is an archived release.
Decline for travel agencies
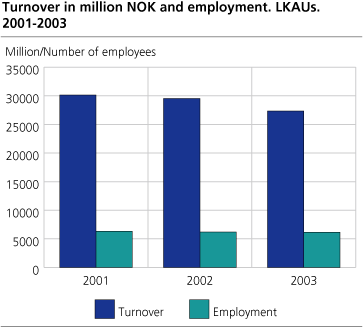
Travel agencies, tourist offices and tour operators had a gross turnover of NOK 27.3 billion in 2003 - a decline of almost NOK 2.2 billion from 2002.
In 2003 there was 1 282 local kind-of-activity units (KAUs) in this industry group. This is an increase of 94 local KAUs compared with the previous year. The gross turnover and the employment on the other hand declined by about 7 per cent and almost 1 per cent respectively in the same period. Gross turnover means the total amount the local KAUs have charged their customers.
On the enterprise level increased the number of enterprises by 104, a change from 996 to 1100. The decrease in the gross turnover and the employment from 2002 was in relative terms equivalent to the local KAUs'.
Highest turnover in travel agencies
At local KAU level the travel agencies constituted about 75 per cent of the total turnover in the industry division. In 2003 the travel agencies had a turnover of NOK 20.5 billion. This is a decrease of 9 per cent compared with 2002. The number of employed people has decreased by 180.
Decline in value added
As a result of a decline in the gross turnover in the industry group the value added also declined last year. The value added has dropped by NOK 70 million to just below NOK 2.1 billion, which equals a decline of about 3 per cent.
Most small local KAUs
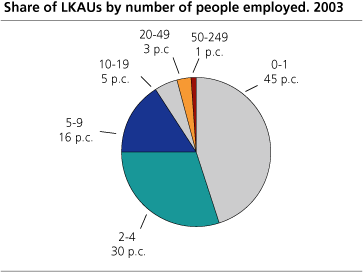
Measured in the number of employed persons, almost 75 per cent of the local KAUs had four or less employed persons. In 2003 their gross turnover was NOK 5.1 billion. The total value added came to NOK 846 million in the same period. These local KAUs constituted almost 19 per cent of the total gross turnover and almost 41 per cent of the total value added.
Local KAUs and enterprises
The figures on the enterprises level may differ from those on local KAU level. This is due to some enterprises being registered after main activity in one industry subclass, but may also consist of local KAUs in other subgroups.
Comparison with previous years
A comparison with previous years of the subclasses is complicated by a relative extensive revision of the industry classification in the Central Register of Establishments and Enterprises. Subsequently, the changes do not necessarily reflect real changes.
For the entire industry group this is not a problem as most changes have been within the group.
More details about definitions can be found in the "About the statistics".
More figures in StatBank.
Tables:
- Table 1 Activities of travel agencies, tourist offices and tour operators. Main figures, by industry subclass. Local kind-of-activity units. 2001-2003
- Table 2 Activities of travel agencies, tourist offices and tour operators. Main figures, by number of people employed and industry group. Local kind-of-activity units. 2003
- Table 3 Activities of travel agencies, tourist offices and tour operators. Main figures, by industry subclass. Enterprises. 2001-2003
- Table 4 Activities of travel agencies, tourist offices and tour operators. Main figures, by number of people employed and industry group. Enterprises. 2003
The statistics is now published as Business statistics.
Contact
-
Statistics Norway's Information Centre
E-mail: informasjon@ssb.no
tel.: (+47) 21 09 46 42


