Content
Published:
This is an archived release.
Higher turnover in travel agencies
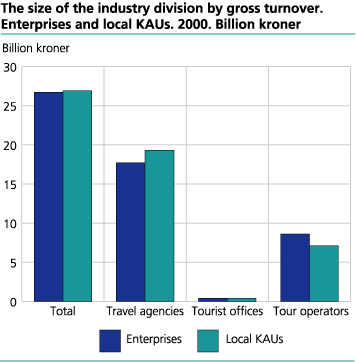
The gross turnover for travel agencies, tourist offices and tour operators increased to 26.9 billion kroner in 2000. At the same time the number of local kind-of-activity units grew, and the number of employed persons decreased.
For the industry division in total there was a growth by nearly 3 per cent in the number of local kind-of-activity units (KAUs), and the gross turnover increased by more than 10 per cent from 1999 to 2000. Gross turnover means the total amount the local KAUs have charged their customers, and not only the provision earned. At enterprise level the growth in gross turnover from 1999 was almost the same as for the local KAUs. The number of enterprises remained stable from 1999 to 2000.
The travel agencies constitute the largest subgroup measured in number of local KAUs, number of employed persons as well as in gross turnover.
The employed earned more
Despite an increase in the number of local KAUs from 1999 to 2000, the employment in the industry division decreased by 2.6 per cent to a good 6 200 persons on average in the year. The personnel costs rose by 4.2 per cent to 1.7 billion kroner. The average personnel costs per person in 2000 were NOK 267 000. This was NOK 18 000 more than in the previous year.
Most small local KAUs
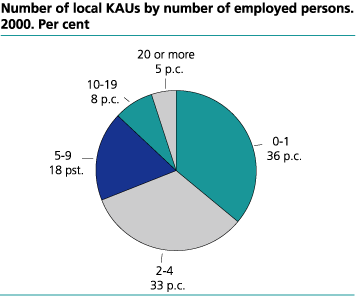
Measured in the number of employed persons, more than half of all local KAUs had four or less employed persons. In 2000 their gross turnover was NOK 4.7 billion. The total value added at factor cost was slightly less than NOK 350 million in the same period. Both constituted under 1/5 of the industry division's gross turnover and value added.
Comparison with previous years
A comparison with previous years of the subgroups is complicated by a relative extensive revision of the industry classification in the Central Register of Establishments and Enterprises. Subsequently, the changes do not necessarily reflect real changes. For the entire industry division this is not a problem as most changes have been within the division.
In addition, the 1999 figures do differ from those previously published due to changes in the register-based data used.
Local KAUs and enterprises
The figures on the enterprise level may differ from those on local KAU level. This is due to some enterprises being registered in one industry subclass after main activity, but also consisting of local KAUs in other subgroups.
More about this and other definitions can be found in the "About the statistics".
Tables:
- Table 1 Activities of travel agencies, tourist offices and tour operators. Main figures, by industry subclass. Local kind-of-activity units. 199 and 2000
- Table 2 Activities of travel agencies, tourist offices and tour operators. Main figures, by industry subclass and number of persons employed. Local kind-of-activity units. 2000
- Table 3 Activities of travel agencies, tourist offices and tour operators. Main figures, by industry subclass. Enterprises. 1999 and 2000
- Table 4 Activities of travel agencies, tourist offices and tour operators. Main figures, by industry subclass and number of persons employed. Enterprises. 2000
The statistics is now published as Business statistics.
Contact
-
Statistics Norway's Information Centre
E-mail: informasjon@ssb.no
tel.: (+47) 21 09 46 42


