Content
Published:
This is an archived release.
Increase in sea and coastal freight transport
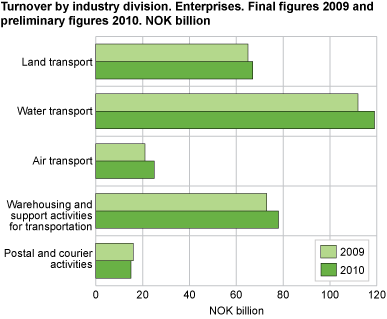
The industry group sea and coastal freight transport had an increase of 6.8 per cent from 2009 to 2010. With a turnover of NOK 107 billion it is still far from the level prior to the financial crisis of NOK 119 billion.
In 2010, the entire sea transport division had a turnover of NOK 118.7 billion; an increase of 6.2 per cent compared to 2009. Despite the increase in turnover, the number of enterprises and employment had a reduction of 0.3 per cent.
Sea and coastal passenger transport had a turnover of NOK 12.1 billion in 2010; an increase of 0.8 per cent compared to 2009.
Increase for land transport
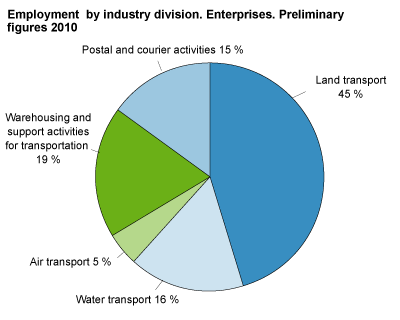
In 2010, this industry division had a turnover of NOK 67.3 billion compared to NOK 65.1 billion in 2009. Turnover in 2010 was nearly at the level of the top year 2008. Employment fell to 67 894 in 2010.
Slight increase for warehousing and support activities for transportation
The industry division had a turnover of NOK 77.7 billion; an increase of 6.6 per cent. Employment fell by 661 to 28 014 employees in 2010.
Preliminary figuresPreliminary figures for structural business statistics are only published for enterprises at the industry group level, and with fewer variables than for final figures. Final figures are normally published 18 months after the end of the reference period. |
Tables:
The statistics is now published as Business statistics.
Contact
-
Statistics Norway's Information Centre
E-mail: informasjon@ssb.no
tel.: (+47) 21 09 46 42


