Content
Published:
This is an archived release.
Moderate value added growth in 2008
Value added for accommodation and food service activities increased 6.8 per cent from 2007 to 2008. The growth corresponds to NOK 1.6 billion, which gives a total value added of NOK 25 billion.
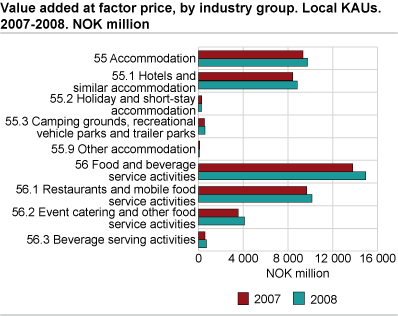
After a long period of strong growth and a record high year in 2007, the growth in value added in 2008 was more moderate. Value added in accommodation and food service activities in 2008 was NOK 9.7 and 14.9 billion respectively. SSB's value and volume indices for the 4t h quarter 2008 show a declining growth in this industry, which is a possible consequence of the finance crisis.
Moderate growth for accommodation
Hotels and similar accommodation was the largest industry group and represented more than 90 per cent of the total value added in the accommodation industry. Norwegian hotels had a turnover of NOK 19.9 billion in 2008, which is an increase of 5.7 per cent from 2007. The turnover growth was mainly due to price increases. This is confirmed by figures from Statistics Norway’s accommodation statistics . Not all the industry groups within the accommodation industry had equally good performance in 2008. Holiday and short-stay accommodation and other accommodation had a decreased value added and turnover. This contributes to a more moderate growth for the whole accommodation industry.
Lower employment, but good economy within food and beverage service activities
There was stronger value added and turnover growth in food and beverage service activities despite lower employment in 2008. Operation of restaurants and cafes employed roughly 1 500 less people in 2008 than in 2007 and had the largest decrease in total employment. At the same time, this industry group represented 67.8 per cent of total value added in the food and beverage service activities industry and had a turnover of NOK 25.6 billion in 2008.
All the industry groups in food and beverage service activities had higher value added and turnover in 2008, but with varying percentages. Figures show that industry groups that mainly serve drinks had less growth than those mainly serving food.
Better profitability in city municipalities
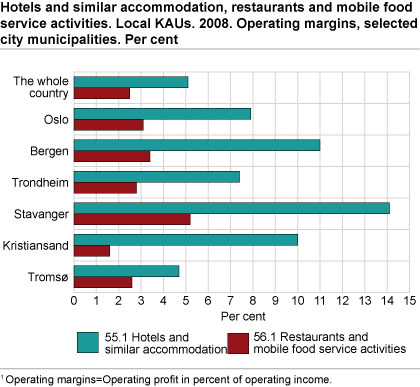
Local KAUs in the six largest municipalities (Oslo, Bergen, Trondheim, Stavanger, Kristiansand and Tromsø) had a value added of NOK 3.3 and 7.2 billion in accommodation and food service activities respectively. Local KAUs in the selected city municipalities represented 34 and 48.2 per cent of the total value added in 2008. These city municipalities had better total operating margins than the country as a whole in both industries. Hotels and similar accommodation, restaurants and mobile food service activities in Stavanger achieved operating margins of 14.1 and 15.2 per cent, which is the highest of all the city municipalities. The capital city employed the most and had an operating margin of 7.9 per cent in hotels and similar accommodation and 3.1 per cent in restaurants and mobile food service activities.
Statistics at enterprise levelThe structural business statistics are compiled both at local KAU level and enterprise level. Figures at the enterprise level will usually deviate from figures at the local KAU level. This is due to the fact that the enterprises are registered in the industry subclass that comprises the main part of the activity of the enterprise, and therefore may be registered in a different industry than some of the local KAUs. Important announcement: Transition to a new industry classificationA new version of the Standard Industrial Classification (SIC2007) was implemented in January 2009. The figures from the most detailed level in this classification are not always directly comparable with previous years. The new Standard Industrial Classification is available here. |
Tables:
- Table 1 Accommodation and food service activities. Main figures, by industry subclass. Local kind-of-activity units. 2007-2008
- Table 2 Hotels and restaurants. Main figures, by number of people employed and industry group. Local kind-of-activity units. 2008
- Table 3 Accommodation and food service activities. Main figures, by industry subclass. Enterprises. 2007-2008
- Table 4 Accommodation and food service activities. Main figures, by number of people employed and industry group. Enterprises. 2008
- Table 5 55 Accommodation. Main figures, by county. Local kind-of-activity units. 2008
- Table 6 56 Food and beverage service activities. Main figures, by county. Local kind-of-activity units. 2008
- Table 7 Accommodation and food service activities. Main figures, selected municipalities. Local kind-of-activity units. 2008
The statistics is now published as Business statistics.
Contact
-
Statistics Norway's Information Centre
E-mail: informasjon@ssb.no
tel.: (+47) 21 09 46 42