Content
Published:
This is an archived release.
Record high value added in 2007
Local KAUs in hotel and restaurant industry had a value added of about NOK 23 billion in 2007, which was an increase of NOK 2.3 billion and 11.1 per cent.
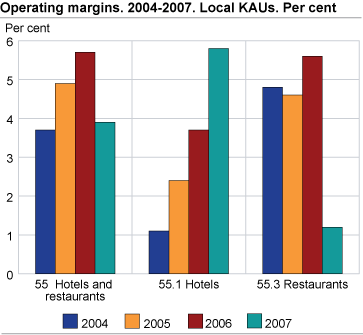
The largest value added increase was created by hotels. Hotels had an operating margin of 5.8 per cent and a total operating result of NOK 1.1 billion in 2007. Consequently, profitability continued to grow. The operating income in 2007 was NOK 19 billion with an increase of 11.8 per cent. Increase of operating income in 2006 was only 9.3 per cent. This industry employed about 24 000 persons and had a turnover increase of 11.9 per cent with an amount of about NOK 19 billion in 2007. This industry had record high gross investments of NOK 1.2 billion. Figures from accommodations statistics show an increase of total guest nights of 4 per cent from 2006 to 2007. The above presented figures all lead to the conclusion that 2007 was a good year for hotels.
More moderate operating results for restaurants
After several years with strong profitability growth, the growth was more moderate in 2007 for restaurants. Operating margins was 1.2 per cent against 5.6 per cent in 2006. Operating income was about NOK 24 billion with an increase of 9.9 per cent. Operating costs was high at the same period, and the total operating results was NOK 303 million. As the largest subgroup in hotel and restaurant industry, restaurants employed about 50 000 persons, which was an increase of 9.3 per cent compared to 2006. Total turnover increased 10.3 per cent.
City municipalities
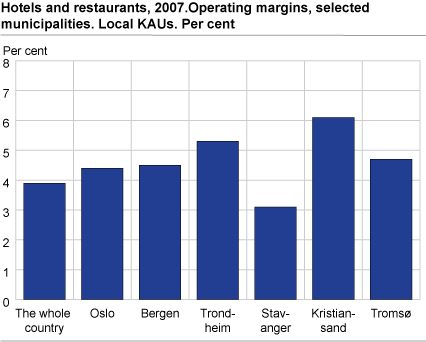
Local KAUs in the six largest municipalities (Oslo, Bergen, Trondheim, Stavanger, Kristiansand and Tromsø) had a turnover of more than NOK 22 billion in 2007. They represented thus over 40 per cent of the total turnover of close to NOK 54 billion in the hotel and restaurant industry. The largest share of turnover was created by restaurants. In 2007 the local restaurants in the above mentioned municipalities had a turnover of about NOK 12 billion, which was almost half of the total turnover for all restaurants. Total operating margin for hotel and restaurant industry for these municipalities was 4.5 per cent and was 0.6 per cent higher than the country average of 3.9 per cent. In the capital city, the turnover was about NOK 12 billion, and the largest operating margin of 6.1 per cent was in Kristiansand municipality.
Statistics on the enterprise levelThe structural business statistics for hotels and restaurants are compiled both on the local KAU level and on the enterprise level. Figures on the enterprise level will usually deviate from figures on the local KAU level. This is due to the fact that the enterprises are registered in the industry subclass that comprises the main part of the activity of the enterprise, and therefore may be registered in a different industry than some of the local KAUs. Revision of industriesIn 2007 and 2008, the enterprises in Statistic Norway’s Central Register of Establishments and Enterprises have been coded in accordance with the new Standard Industrial Classification (SN2007). This has revealed some incorrectly classified enterprises and local KAUs. In such cases, the code according to the current standard (SN2002) has been revised. The new Standard Industrial Classification (SN2007) will be used for the first time in the publishing of preliminary figures for the statistical year of 2008, in October 2009. You will find descriptions of the classifications here . |
Changes in the comparison basis 2006Errors in final figures for 2006 are identified and corrected. New figures for 2006 are used in the comparison with 2007 figures. The changes affect only figures on the local KAUs. The changes are minor. |
Tables:
- Table 1 Hotels and restaurants. Main figures, by industry subclass. Local kind-of-activity units. 2004-2007
- Table 2 Hotels and restaurants. Main figures, by number of people employed and industry group. Local kind-of-activity units. 2007
- Table 3 Hotels and restaurant. Main figures, by industry subclass. Enterprises. 2004-2007
- Table 4 Hotels and restaurants. Main figures, by number of people employed and industry group. Enterprises. 2007
- Table 5 55 Hotels and restaurants. Main figures, by county. Local kind-of-activity units. 2007
- Table 6 55.1 Hotels. Main figures, by county. Local kind-of-activity units. 2007
- Table 7 55.2 Camping sites and other provision of short-stay accommodation. Main figures, by county. Local kind-of-activity units. 2007
- Table 8 55.3 Restaurants. Main figures, by county. Local kind-of-activity units. 2007
- Table 9 55.4 Bars. Main figures, by county. Local kind-of-activity units. 2007
- Table 10 55.5 Canteens and catering. Main figures, by county. Local kind-of-activity units. 2007
- Table 11 55.1 Hotels. Main figures, selected municipalities. Local kind-of-activity units. 2007
- Table 12 55. 2 Camping sites and other provision of short-stay accommodation . Main figures, selected municipalities. Local kind-of-activity units. 2007
- Table 13 55.3 Restaurants. Main figures, selected municipalities. Local kind-of-activity units. 2007
- Table 14 55.4 Bars. Main figures, selected municipalities. Local kind-of-activity units. 2007
- Table 15 55.5 Canteens and catering. Main figures, selected municipalities. Local kind-of-activity units. 2007
The statistics is now published as Business statistics.
Contact
-
Statistics Norway's Information Centre
E-mail: informasjon@ssb.no
tel.: (+47) 21 09 46 42


