Content
Published:
This is an archived release.
Goods transported further
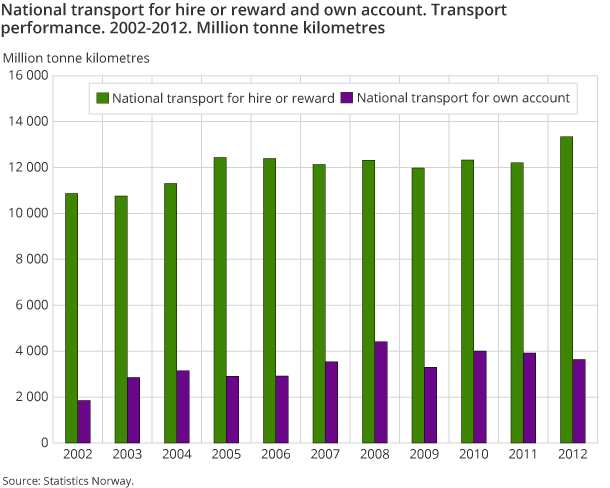
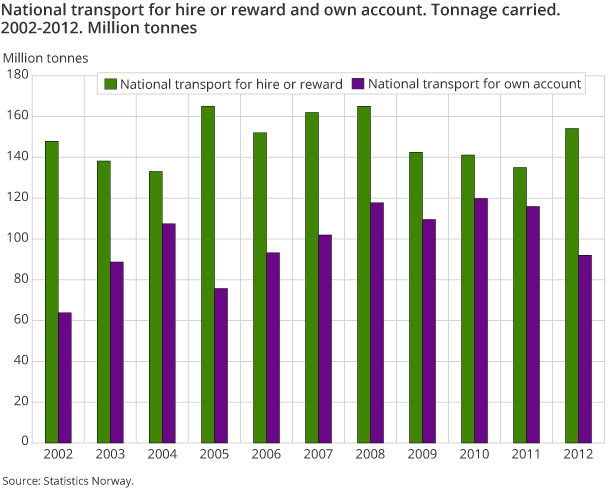
The national transport performance by lorry increased from 2011 to 2012, but tonnage transported slightly decreased. Therefore, goods were transported further on average. In international transport by Norwegian lorries the trend was the same as in national transport.
| 4th quarter 2012 | Change in per cent | |||
|---|---|---|---|---|
| Transport performance (mill. tonne-kms) | Share | 4th quarter 2011 - 4th quarter 2012 | 4th quarter 2007 - 4th quarter 2012 | |
| National and international transport, total | 5 375.0 | 100.0 | 0.2 | 3.4 |
| National transport for hire or reward and own account | 4 477.5 | 83.3 | -2.2 | 6.2 |
| National transport for hire or reward | 3 775.0 | 70.2 | 4.3 | 15.1 |
| National transport for own account | 702.5 | 13.1 | -26.7 | -24.9 |
| International transport for hire or reward and own account | 897.5 | 16.7 | 14.3 | -8.6 |
The transport volumes for Norwegian lorries with a gross vehicle weight above 3.5 tonnes increased domestically by 1.9 per cent from 2011 to 2012. The average transport distance per tonne increased, however, by 5.3 per cent, from 64.3 to 69.0 kilometres.
More empty driving
Much of the domestic transport of goods entails a non-natural return load. For example, the transport of gravel, sand, waste and building materials made up almost 30 per cent of all transported goods in 2012. The transport of timber also entails a considerable share of empty kilometres. In 2012, the share of kilometres driven without a load was 26.4 per cent, which corresponds to 0.5 billion. This is an increase of 0.7 percentage points from the previous year. The total distance covered by heavy goods vehicles was 1.9 billion kilometres in 2012.
Decrease in international transport
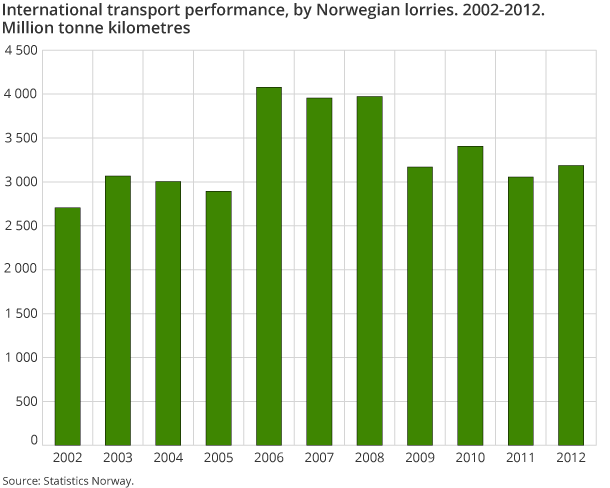
Despite the 4.3 per cent increase in the transport performance of Norwegian lorries to and from abroad from 2011 to 2012, the trend continues to fall. In 2007, transport performance in connection with import and export was 4.0 billion tonne kilometres, compared to 3.2 billion in 2012. The amount of goods transported saw a corresponding increase. A total of 6.6 million tonnes was transported abroad by Norwegian lorries in 2007, compared with 5.3 million tonnes in 2012. Compared with 2011, this was a decrease of 1.4 per cent. Foreign transport covers long distances, and on average every tonne was transported 600 kilometres in 2012. The share of empty kilometres is considerably lower than in domestic transport, and was 15.8 per cent in 2012.
Increased share for hired transport
The share of goods that is transported for a client for payment increased from 2011 to 2012. In 2012, 78.5 per cent of the transport performance was carried out by lorries in hired transport, compared with 75.7 per cent in 2012. The share for tonnage carried was slightly smaller, but increased from 53.8 to 62.6 per cent in the same period.
Decrease in 4th quarter
The transport performance of Norwegian lorries was 4.5 billion tonne kilometres in the 4th quarter of 2012; a 2.2 per cent drop from the corresponding quarter in 2011. Tonnage transported fell by 5.2 per cent. The transport performance of Norwegian-registered vehicles in international transport increased by 14.3 per cent compared with the corresponding quarter in 2011, while tonnage transported fell by 9.2 per cent.
The statistics is now published as Carriage of goods by lorry.
Contact
-
Statistics Norway's Information Centre
E-mail: informasjon@ssb.no
tel.: (+47) 21 09 46 42


