Content
Published:
This is an archived release.
Vans driven extensively
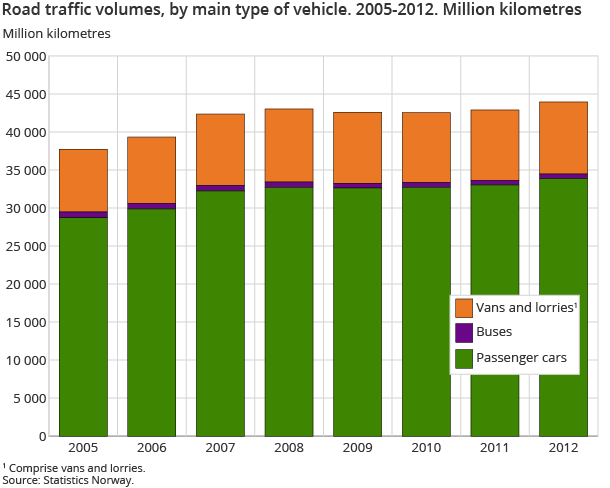
As in 2011, passenger cars accounted for 77 per cent of all driving last year and consequently dominated the total traffic. However, the number of vans on the road is increasing, and accounted for 15 per cent of total kilometres driven in 2012.
| Vehicle-kilometres (million kms) | Share | Per cent | ||
|---|---|---|---|---|
| 2011 - 2012 | 2007 - 2012 | |||
| 2012 | ||||
| All vehicles | 43 952 | 100.0 | 2.4 | 3.7 |
| All passenger cars | 33 876 | 77.1 | 2.6 | 5.1 |
| All buses | 597 | 1.4 | -2.3 | -17.3 |
| All vans and small lorries | 7 541 | 17.2 | 2.2 | 2.1 |
| All heavy lorries and road tractors | 1 938 | 4.4 | 3.2 | -3.7 |
Norwegian passenger cars were driven nearly 34 billion kilometres in 2012; 2.6 per cent more than the year before. There are no signs of passenger cars' share of the total volume of traffic on the roads decreasing. Passenger cars have accounted for over three-quarters of kilometres driven for several years.
The total number of kilometres driven amounted to 44 billion, representing a 2.4 per cent increase from 2011 to 2012.
Vans on the rise
Vans are becoming increasingly popular in Norway, and are used both as passenger and freight transport. In 2012, small and large vans were driven a total of 6.7 billion kilometres; 4.2 per cent more than the year before. This was 15 per cent of all kilometres driven in 2012. In 2005, the share was over 12 per cent (4.6 billion kilometres). In comparison, the large lorries drove 1.9 billion kilometres in 2012; 3.2 per cent more than in 2011. The distance driven in small goods vehicles decreased.
Many old cars, but they are not driven as much
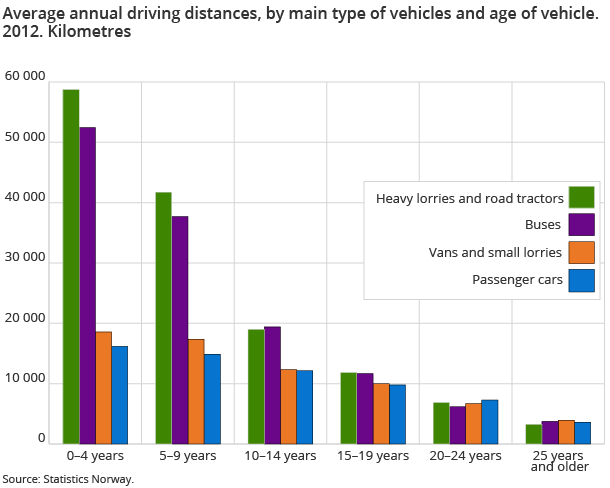
Norway has a relatively old fleet of cars, with an average age of 10.5 years for passenger cars, but newer vehicles are driven the farthest. Thirty-five per cent of all kilometres driven last year were driven in cars that were less than five years old. There are significant differences between vehicle groups. While the newer passenger cars carried 33 per cent of the total mileage of the group, the corresponding share was 56 per cent for heavy lorries. Taxis and semi-trailer trucks had the largest share of kilometres driven by cars that were under five years old, with 88 and 68 per cent respectively.
Stable average distances driven
The average passenger car drove 12 900 kilometres in 2012, the same as in 2011. As one would expect, new vehicles are driven the longest distances on average. The highest average distance driven was for semi-trailer trucks, with 67 000 kilometres, followed by taxis with 58 600 kilometres.
Diesel continues to increase
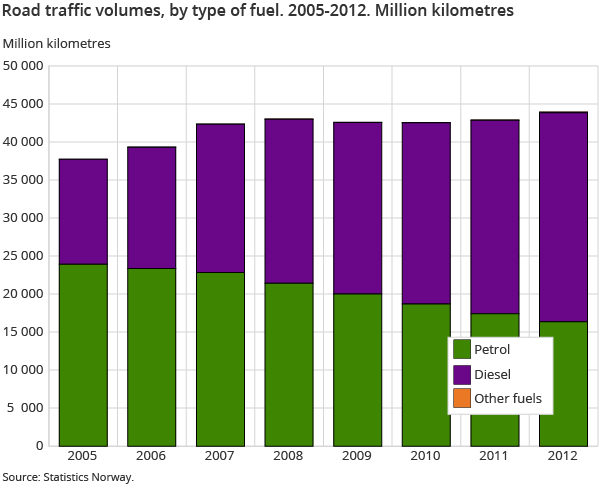
The share of kilometres driven by diesel cars is increasing. In 2005, diesel-powered vehicles accounted for 37 per cent of total kilometres driven. In 2011, the percentage increased to 59 per cent, while in 2012 it was 63 per cent. Although the distance driven for all categories of fuel other than diesel and gasoline nearly doubled from 2011 to 2012, the share was still a negligible 0.2 per cent of the kilometres driven.
Cars from Akershus and Oslo driven the farthest
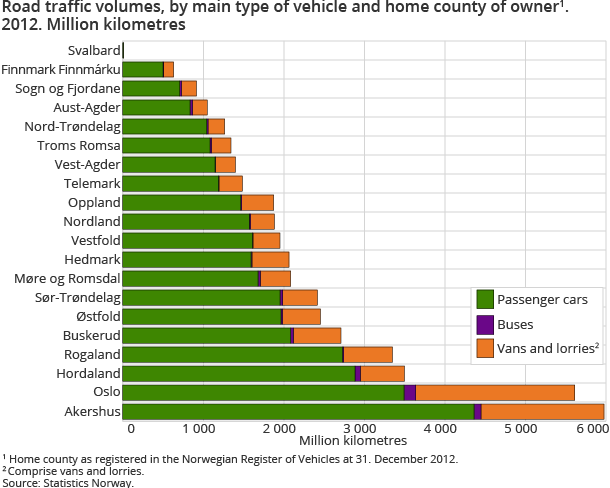
Cars registered in Akershus and Oslo covered 6.0 and almost 5.6 billion kilometres respectively in 2012. These made up the largest shares of kilometres driven, with 13.6 and 12.8 per cent respectively. Cars registered in Hordaland had the second highest distance driven, with an 8.0 per cent share in 2012.
Contact
-
Henrik Bråthen
E-mail: henrik.brathen@ssb.no
tel.: (+47) 40 81 14 03
-
Geir Martin Pilskog
E-mail: geir.martin.pilskog@ssb.no
tel.: (+47) 40 81 13 83
-
Nataliya Granerud
E-mail: nataliya.granerud@ssb.no
tel.: (+47) 40 81 13 96


