Content
Published:
This is an archived release.
More trains on time
The Norwegian National Rail Administration statistics about punctuality show that the tendency from 2011 of fewer delayed trains continues in 2012. At the same time, the amount of dead time was considerably reduced.
| 2010 | 2011 | 2012 | Per cent | |
|---|---|---|---|---|
| 2011 - 2012 | ||||
| Corrected 25 October 2013. | ||||
| Input | ||||
| Operating expenditures (NOK mill.) | 4 926 | 5 818 | 6 090 | 4.7 |
| Investments (NOK mill.) | 5 478 | 5 391 | 6 309 | 17.0 |
| Contracted man-years adjusted for long term leaves | 3 285 | 3 555 | 3 649 | 2.6 |
| Activities and services | ||||
| Main lines (kms) | 4 167 | 4 154 | 4 246 | 2.2 |
| Level crossings | 3 601 | 3 826 | 3 690 | -3.6 |
| Crossings with barriers, lights and klaxons | 469 | 462 | 373 | -19.3 |
| Passing loops > 600 meter (number) | 134 | 138 | 139 | 0.7 |
| Outcome | ||||
| Uptime (per cent) | 98.4 | 98.5 | 98.8 | 0.3 |
| Hours of dead time | 11 972 | 10 633 | 8 462 | -20.4 |
| Percentage double track (per cent) | 6 | 6 | 6 | 0.0 |
| Percentage passing loops (numbers) > 600 metres (per cent) | 41.3 | 42.2 | 42.5 | 0.7 |
| Unit costs | ||||
| Driftskostnad per km bane hovedspor | 826 | 741 | 731 | -1.3 |


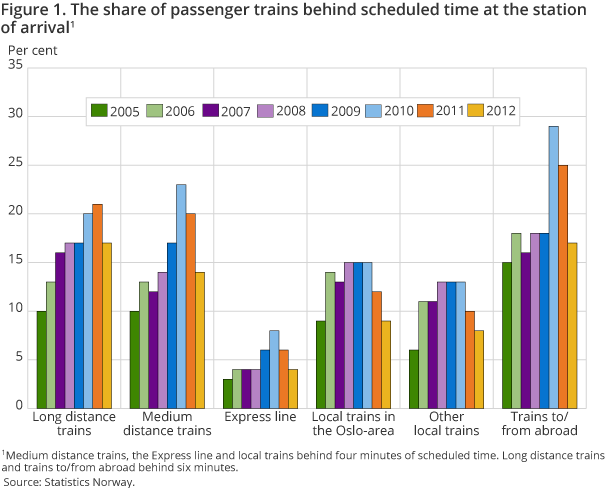
The statistics show a fall in punctuality from 2005 to 2010 for all types of trains. The share of delayed trains was doubled in this period. In 2011, the negative trend in punctuality was broken with the exception of a tiny fall in punctuality for the long distance trains. This tendency continues in 2012. All types of trains, including the long distance trains, had an improvement in punctuality compared to 2011. The punctuality for the local trains in the Oslo area in 2012 was back to the 2005 level, i.e. 9 per cent of the trains were not within the scheduled time for arrival. The express line (Flytoget) was also “back on track” in 2012. Only 4 per cent of these trains did not arrive on time.
20 per cent less dead time in 2012
About 8 450 hours of dead time for both passenger and goods trains were due to incidents related to infrastructure and external conditions in 2012. This was a decrease of 2 200 hours compared to 2011, and 3 500 compared to 2010. Defects in the signalling and interlocking installations and on the railway lines caused by broken rails and switches comprised 4 550 hours of delays (54 per cent) altogether. Of the twelve railway lines with the highest traffic load shown in the statistics, the Main line (Oslo – Eidsvoll) and the Dovre line combined constituted 34 per cent of the total dead time.
Increasing share of younger employees
The total number of man-years in the Norwegian National Rail Administration among employees younger than 30 years, adjusted for long-term leave, increased by 242 from 2009 to 540 in 2012. At the same time, this age group’s share of man-years increased by 5 percentage points to 15 per cent.
Considerable growth in investments
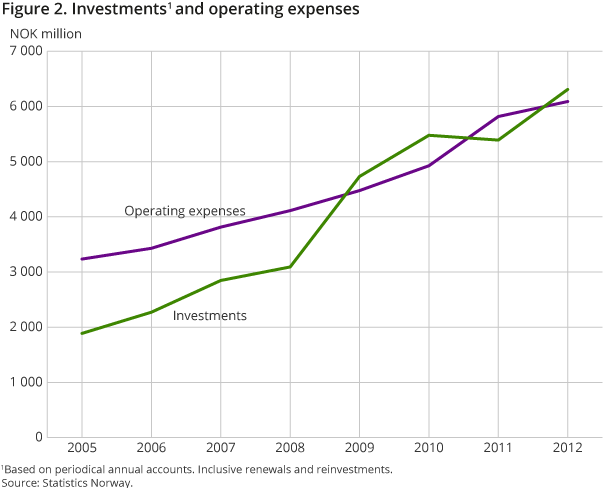
Government investments in the rail network came to NOK 6.3 billion in 2012. This was an increase of NOK 0.9 billion from 2011. In the period 2005-2012, the investments were more than tripled.
Simultaneously with the considerable increase in investments, the operating expenditures were doubled in 2012 compared to 2005 and constituted NOK 6.1 billion in 2012. The increase in these costs from 2011 to 2012 came to about NOK 270 million. Forty-six per cent of the operating expenditures were wages.
More than 1/3 of costs spent on the line
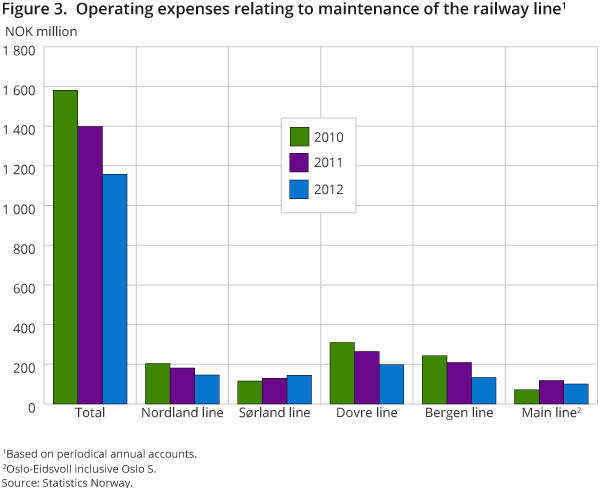
The costs spent on the maintenance and upgrading of the infrastructure came to NOK 3.1 billion in 2012. After a growth in these costs of NOK 1 billion from 2008 to 2009, the yearly costs spent on maintenance and upgrading of the infrastructure have amounted to somewhat more than NOK 3 billion thereafter. NOK 1.2 billion related to the maintenance and upgrading of the railway line; a decrease of NOK 240 million from 2011. Signalling/interlockings and electrification were other significant maintenance items, with about NOK 400 million each in 2012.
Better access
Though the number of passenger stations was reduced by 5 per cent from 2011 to 338 in 2012, the number of stations with text and/or sound information increased by 30. The share of stations with such information increased from 77 per cent in 2011 to 89 per cent in 2012. The number of platforms that are in accordance with standard universal design increased by 11 in 2012 to 38.
Find more figures
Also find statistics about the quality of the track, number of stations, platforms, tunnels and bridges.
Additional information
The statistics give an overview of the amount of resources the Norwegian National Rail Administration spends on administrating the infrastructure, the operational management of trains and assigning routes, and the results of the effort.
Contact
-
Statistics Norway's Information Centre
E-mail: informasjon@ssb.no
tel.: (+47) 21 09 46 42
