Content
Published:
This is an archived release.
Stock of goods vehicles decreasing
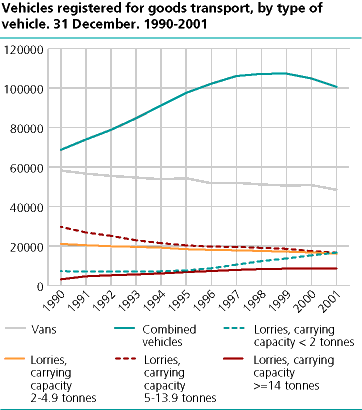
A total of 222 235 vehicles were registered for goods transport in Norway by the end of 2001. These vehicles had a total carrying capacity of 727 507 tonnes. The number of vans and combined vehicles has decreased during the last year, while the number of lorries and special vehicles has remained fairly constant.
From 2000 to 2001 the number of goods vehicles decreased by 3.0 per cent, while the total carrying capacity went down by 1.2 per cent. This indicates that the strongest decline in the number of vehicles has been amongst the vehicles with a lower carrying capacity.
The stock of goods vehicles has risen by 9.7 per cent, or 19 590 vehicles during the last ten years. The average yearly rate of growth from 1990 to 1999 was 1.66 per cent, while the corresponding growth rate from 1999 to 2001 was 1.87 per cent. The rate of growth for carrying capacity was 0.87 per cent from 1990 to 1999, and -1.05 per cent from 1999 to 2001.
Light lorries up, vans down
The number of vans went down by 4.8 per cent or 2,432 vehicles from 2000 to 2001. The number of lorries with a carrying capacity of less than two tonnes increased by 9.0 per cent or 1 373 vehicles during the same period.
The number of heavy lorries (with a carrying capacity of more than 15 tonnes) increased by 72 vehicles or 1.5 per cent from 2000 to 2001. However, the increase in carrying capacity for this group was 1.9 per cent, indicating that the largest increase is amongst the heaviest vehicles in this group.
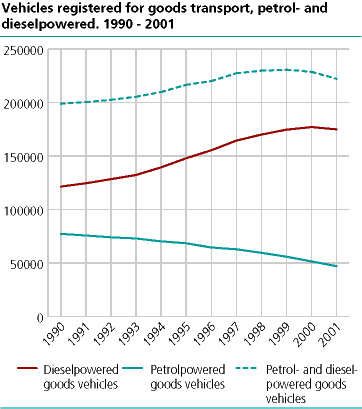
79 per cent
of the stock of vehicles at the end of 2001 were diesel-powered. In 1991 the corresponding share was 62 per cent. From 1999 to 2001 the number of petrol-powered goods vehicles decreased by 15.7 per cent, while the number of diesel-powered goods vehicles increased by 0.2 per cent. The share of diesel-powered lorries with a carrying capacity of less than two tonnes increased from 72.4 per cent in 1991 to 84.2 per cent in 2001. The stock of diesel-powered lorries with a carrying capacity of less than two tonnes has increased by 174.8 per cent since 1990.
Stock largest in Akershus and Hordaland
At the end of 2001 the stock of goods vehicles in Akershus county was 27,458 vehicles, the largest number in Norway. Hordaland and Oslo followed with 21,444 and 21 227 goods vehicles respectively. Akershus and Oslo have 21.9 per cent of the total stock of goods vehicles in Norway. Akershus was the only Norwegian county that had an increase in the number of goods vehicles from 2000 to 2001. The increase was 8.4 per cent or 2,133 vehicles. Rogaland had the largest decrease in number of goods vehicles from 2000, and this decrease was 7.5 per cent.
Tables:
- Table 1 Registered road goods vehicles, by type of vehicle. 31 December
- Table 2 Carrying capacity of registered road goods vehicles, by type of vehicle. 31 December. Tonnes
- Table 3 Registered road goods vehicles, by type of vehicle and county. 31 December 2001
- Table 4 Carrying capacity of registered road goods vehicles, by type of vehicle and county. 31 December 2001. Tonnes
The statistics is published with Registered vehicles.


