Content
Published:
This is an archived release.
Increase in transport activity
The number of taxi trips and turnover increased significantly during the first quarter of 2011 relative to the same quarter in 2010. Capacity utilisation also increased during the same period.
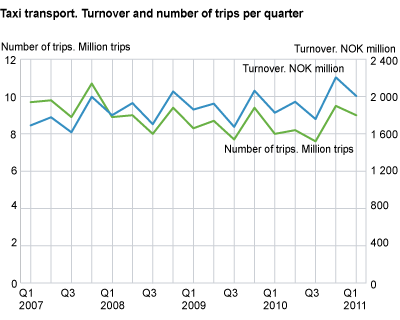
The taxi industry registered increased transport activity during the first quarter of 2011. The industry earned revenue of NOK 2 007million during the 1st quarter this year, which is 10 per cent higher than the same period last year. The number of taxi trips also increased by 13 per cent compared to the 1st quarter of 2010.The taxi fare, on the other hand, remained relatively stable during the last year.
Hours occupied increase while kilometres driven declined
The number of hours offered by the taxi industry amounted to a total of 8.6 million, which is 5 per cent higher than the same quarter last year. Of this, 3.8 million hours were driven with passengers during the 1st quarter of 2011, which is also 8 per cent higher than the same quarter last year.
The industry covered a total of about 9 million trips during the 1st quarter this year, which is 13 per cent higher than the same quarter last year. This amounts to 85 million kilometres driven with passengers; 8 per cent lower than the same quarter a year before. Consequently, the average mileage per trip fell to 9.5 kilometres, from 11.6 during the 1st quarter of 2010. Similarly, the total number of kilometres driven also declined by 5 per cent during the same period.
Increased occupancy rate
Capacity utilisation as measured by number of hours occupied to the number of hours on offer increased to 45.5 per cent during the first quarter of 2011 compared to 43.2 per cent during the same period in 2010.
|
The taxi statistics are based on a nationwide survey carried out quarterly on the taxi business classified by code 49.320, Taxi Operation in SIC07. The survey covers over 90 per cent of the taxi population in the country. The data is then scaled up to population size using a factor. This factor is calculated based on data from the survey and VAT data reported to the Directorate of Taxes. |
Tables:
This page has been discontinued, see Taxi transport, Annually.
Contact
-
Geir Martin Pilskog
E-mail: geir.martin.pilskog@ssb.no
tel.: (+47) 40 81 13 83