Content
Published:
This is an archived release.
Taxi most expensive in Oslo
In 2015, the price per kilometre with passengers averaged NOK 29 for the whole country. A taxi kilometre was most expensive in Oslo and least expensive in Hedmark.
| 2014 | 2015 | Change in per cent | |
|---|---|---|---|
| 2014 - 2015 | |||
| Transport acivity | |||
| Turnover (NOK million) | 8 116 | 8 142 | 0.3 |
| Total length driven (1000 km) | 532 757 | 524 486 | -1.6 |
| Lenght driven with passengers (1 000 km) | 282 907 | 277 598 | -1.9 |
| Proportion driven with passenger in the car (per cent) | 53.1 | 52.9 | -0.4 |
| Price per kilometer with passenger (NOK/km) | 29 | 29 | 0.0 |
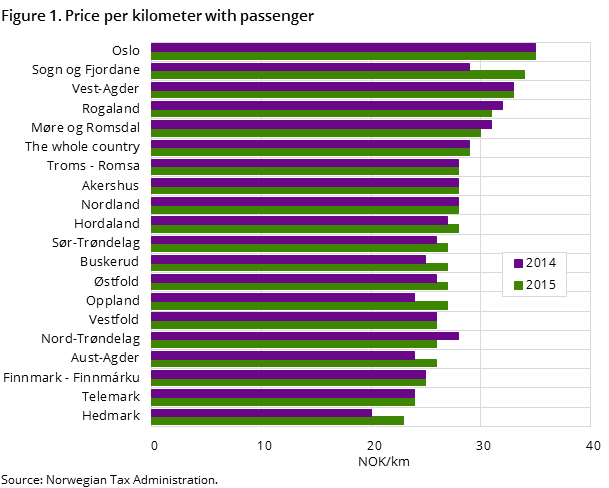

Revenue divided by kilometres driven with passengers gives an average price per utilised kilometres. The calculation does not take into account the time the driving was conducted or volumes of taxi contracts for municipalities, hospitals or private enterprises etc. In 2015, the average kilometre price for the whole country was NOK 29. This equates to the same price level as in 2014. There were significant regional differences for price per taxi kilometre. In 2015, Oslo had the highest taxi price with NOK 35, while the prices were lowest in Hedmark, at NOK 23. Compared to 2014, the county price changes were generally small.
NOK 1 million per licence
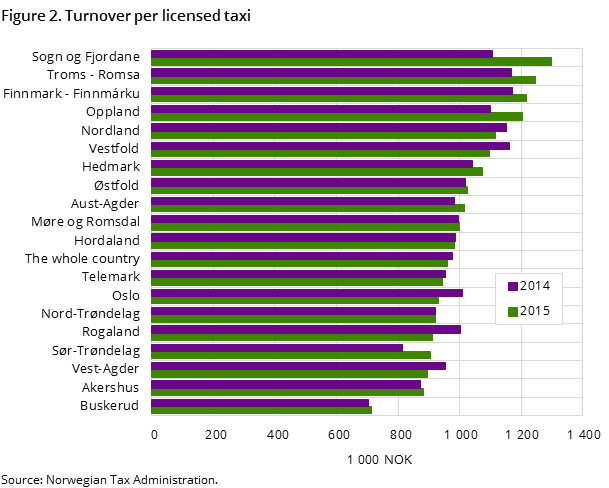
Taxi turnover increased by 0.3 per cent from NOK 8 116 million in 2014 to NOK 8 142 million in 2015. Revenue divided by taxi licences gives the average revenue per enterprise with a licence to drive a taxi. In 2015, the average turnover per enterprise was NOK 961 000. This is a decrease of NOK 15 000 or 1.6 per cent compared to 2014. In most counties, turnover per licence was between NOK 900 000 and NOK 1.1 million. Buskerud stood out with a lower turnover, in excess of NOK 700 000. Four counties, Oppland, Finnmark, Troms and Sogn og Fjordane, had turnover between NOK 1.2 and 1.3 million. Compared to 2014, the county revenue changes were generally small.
NOK 1 600 per inhabitant on taxi transport
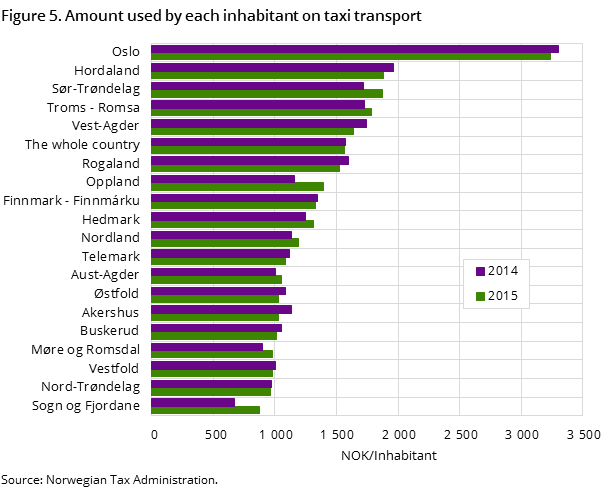
Revenue divided by population figures indicates the average consumption per person of taxi transport. In 2015, residents in Norway spent an average of NOK 1 561 on taxis. Oslo has many visitors who use taxis to and from other forms of public transport. Revenue divided by population showed a consumption of NOK 3 234 in Oslo in 2015. Hordaland and Sør-Trøndelag followed with around NOK 1 900. In Sogn og Fjordane the population spent least on taxi transport, averaging about NOK 900. Compared to 2014, the differences in consumption were generally small.
Half of the kilometres with passengers
The total taxi mileage was 524 million kilometres in 2015. This was 1.6 per cent lower than in 2014. A total of 52.9 per cent of the total mileage was conducted with passengers, which is equivalent to 278 million km. This is a decrease of 0.4 per cent compared to 2014. In this year, taxis transported passengers in 53.1 per cent of their total mileage or 283 million kilometres. There were significant regional differences in the proportions of mileage with passengers in the car. In 2015, Finnmark had the highest proportion of driving with passengers, at 71.0 per cent, while Rogaland had a proportion of 44.9 per cent. Compared to 2014, the county changes in mileage with passengers were generally small.
53 kilometres in taxis
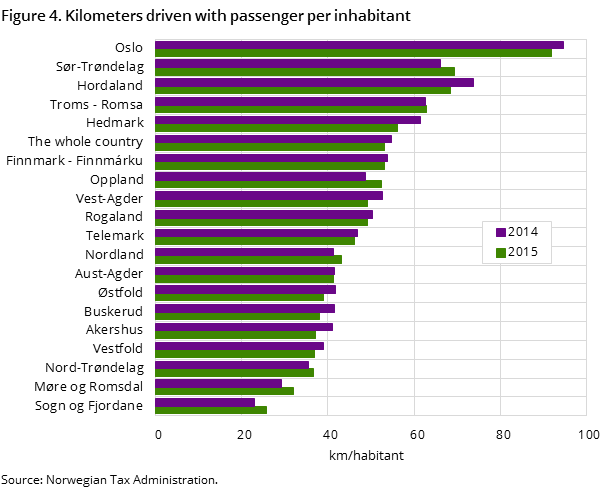
Kilometres driven with passengers divided by the number of inhabitants indicates average taxi usage per person. In 2015, the population drove on average 53.2 km in a taxi, compared with 54.8 in 2014; a decline of 2.9 per cent. In Oslo, kilometres divided by population gives an average of 91.9 km in taxi mileage. The same calculation shows least taxi mileage per person in Sogn og Fjordane, with 25.7 km. Compared to 2014, the differences in county kilometre lengths were generally small.
Taxi statistics based on data already collected by the Norwegian Tax AdministrationOpen and readClose
The Norwegian Tax Administration collects data annually about the approximately 8 500 companies with a taxi licence. The reported data are cash sales, electronic sales, mileage and mileage with passengers. The Norwegian Tax Administration uses this information to verify that the enterprises adhere to tax rules. Statistics Norway reuses the information to publish statistics.
Contact
-
Geir Martin Pilskog
E-mail: geir.martin.pilskog@ssb.no
tel.: (+47) 40 81 13 83
