Content
Published:
This is an archived release.
Increase in radio and television in 2010
Sales in radio and television broadcasting went up by 8 per cent from the previous year to NOK 9.6 billion, while employment was almost the same, with 5 843 employees in 2010.
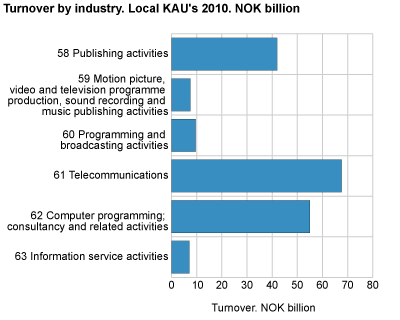
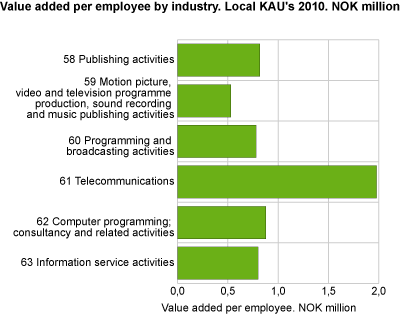
Sales for local kind-of-activity units in the industry group radio and television were NOK 9.6 billion in 2010. The industry consisted of 216 companies, which is a decline of 8 per cent from 2009. Value added increased by 6 per cent to NOK 4.6 billion in 2010. Production value increased 8 per cent to NOK 9.6 billion.
Publishing stable
Turnover in the publishing industry group was NOK 42 billion in 2010; an increase of 2 per cent from the year before. Employment was equivalent to a decrease of 3 per cent in the period, to 23 589 employees. Value added for the group increased by 2 per cent, while the production value increased by 3 per cent to NOK 41.9 billion. Turnover among companies that publish newspapers increased from NOK 14.4 billion in 2009 to NOK 14.8 billion in 2010, and value added increased by 7 per cent. The other industry group in publishing, publishing software, reported a revenue growth of 6 per cent in 2010. Value added was up 2 per cent to NOK 7.7 billion and employment increased by 2 per cent to 8 393 persons.
Decline for cinemas
Motion picture and film theatres showed a major increase in 2009, but this changed in 2010, and the turnover declined 4 per cent to NOK 1.2 billion in 2010. The value added declined 14 per cent or NOK 58 million.
The industry group that includes film theatres; "Motion picture, video and television programme production," shows NOK 7.5 billion in turnover in 2010; an increase of 2 per cent. Value added increased by 3 per cent to NOK 2.3 billion. "Production of film, video and television programmes", showed major growth, with turnover up 12 per cent to NOK 3.2 billion. The second largest industry group, "Motion picture, video and television programme distribution activities", lost revenue to new sales channels and the revenue fell 7 per cent to NOK 1.8 billion.
Telecommunication
The total turnover in telecommunication amounted to NOK 67.6 billion, which is an increase of 3 per cent. The number of enterprises in the industry fell by 2 per cent to 789, and employment increased by 1 per cent to 13 017 in 2010. The value added increased 2 per cent to NOK 25.7 billion and correspondingly the production value increased 3 per cent from 2009 to 2010.
Due to changes in industry group codes in 2010 for local kind-of-activity units in wired telecommunications and wireless telecommunications activities, these statistics are not comparable to previous years. In particular, employment within wireless telecommunications showed a remarkable increase, with a corresponding decrease within wired telecommunications activities in 2010. The aggregate figure for these two groups is comparable to previous years and indicated a 4 per cent increase in revenues and 2 per cent increase in employment. Satellite telecommunication on the other hand experienced a decrease in turnover of 2 per cent, to NOK 4.4 billion. Value added decreased 7 per cent, while employment rose 7 per cent.
Information technology services
Information technology services include programming services, consulting and management and operation of IT systems. Turnover in 2010 rose 8 per cent and employment increased 3 per cent. The number of enterprises in the sector rose by 71 in 2010 and the value added rose by 7 per cent to NOK 29.6 billion in the period.
The smallest industry in information and communications; information services, grew by 7 per cent to NOK 7.1 billion, and showed stable employment in the period. Special web portals showed the strongest growth, with a revenue increase of 13 per cent to NOK 2.8 billion. Value added increased by 17 per cent and the production value increased 14 per cent from 2009 to 2010.
Statistics at enterprise levelStructural business statistics for information and communication are compiled both at local KAU level and enterprise level. Figures at the enterprise level will usually deviate from figures at the local KAU level. This is due to the fact that the enterprises are registered in the industry sub-class that comprises the main part of the activity of the enterprise, and therefore may be registered in a different industry from some of the local KAUs. |
Value added and production valueStructural value added is the total of production value less the purchase of goods and services (for other goods and services than those purchased for resale) and corrected for changes in stocks of raw materials and consumables. Special public grants for manufactured/sold merchandise and other public grants/reimbursements are included. Production value means turnover adjusted for changes in inventory, and goods and services purchased for resale. |
Comparability between 2009 and 2010Many enterprises and local KAUs within the industry division Information and communication (J) operate within different industries. The unit is placed in the division in which it has its main activity. If a unit changes its activity it may also have to move to a different industry. This is more common within industry division J than in most other industries. The result is that figures in one year may not necessarily be directly comparable to subsequent years. This year, telecommunication has particularly many changes within wired and wireless telecommunication. The effect of this is normally greater in figures for enterprises than for local KAUs. |
Tables:
- Table 1 Information and communication. Principal figures, by industry subclass. Local kind-of-activity units. 2009-2010
- Table 2 Information and communication. Principal figures, by number of persons employed and industry group. Local kind-of-activity units. 2010
- Table 3 Information and communication. Principal figures, by county. Local kind-of-activity units. 2010
- Table 4 Information and communication. Principal figures, by industry subclass. Enterprises. 2009 -2010
- Table 5 Information and communication. Principal figures, by number of persons employed and industry group. Enterprises. 2010
The statistics is now published as Business statistics.
Contact
-
Statistics Norway's Information Centre
E-mail: informasjon@ssb.no
tel.: (+47) 21 09 46 42


