Content
Published:
Post and telecom was still growing in 2007
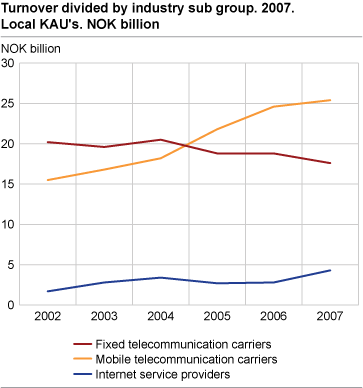
Turnover in Post and telecom continued to grow in 2007, and closed in at almost NOK 79 billion. Mobile operators had the highest turnover, NOK 25 billion, but the operating result in this industry class was lower than in 2006.
Businesses within post and telecommunications increased their turnover by 4.8 per cent from 2006. They had 38 482 employees, an increase of 1.2 per cent from 2006. The value added fell for the first time in several years. In 2007 it was NOK 31.6 billion, down 1.2 per cent from the previous year.
Post and telecommunications consists of national post activities, courier activities other than national post activities, fixed telecommunication carriers, mobile telecommunication carriers, internet service providers and other telecommunication activities. The employment is by far highest within national post activities. In 2007 they employed 18 408 persons. Turnover however was the highest within mobile telecommunication carriers. Courier activities other than national post activities had the biggest increase in new businesses, with 194 new enterprises. It counted 1 219 business in 2007.
Weaker operating result for mobile
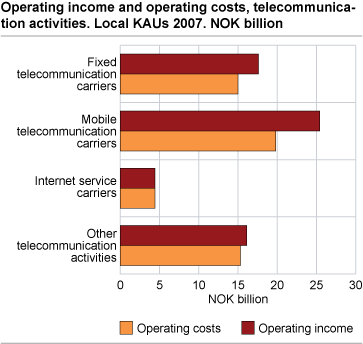
The operating result for businesses within mobile telecommunication carriers ended at NOK 5.6 billion in 2007, 1.2 billion less than 2006. The main reason for this was higher operating costs. Operating costs increased by 11.1 per cent, while operating income only increased 3.3 per cent. However, the operating result in 2007 was the second highest since 2002. The business created values for NOK 8.9 billion. On average, this is NOK 1 million less per employee than in 2006.
Valued added highest for business with 50-249 employees
The employment group 50-249 consisted of 66 businesses and 6 513 employees. Value added per employee was NOK 1.54 million, half a million more than in any other employment group. Personnel costs per employee was NOK 481 000.
Average value added per employee for the entire industry was 821 000, and personnel costs per employee was NOK 405 000.
Statistics on the enterprise level
The structural business statistics for post and telecommunication activities are compiled both on the local KAU level and on the enterprise level. Turnover and employment on the enterprise level developed much like the figures on the local KAU level. The enterprises had 38 907 employees combined and an added value of NOK 31.6 billion.
County figuresA few big companies characterize the industries telecommunication and post activities. Restructurings in these companies will have a considerable influence on the county figures. Statistics on the enterprise levelThe structural business statistics for land transport are compiled both on the local KAU level and on the enterprise level. Figures on the enterprise level will usually deviate from figures on the local KAU level. This is due to the fact that the enterprises are registered in the industry subclass that comprises the main part of the activity of the enterprise, and therefore may be registered in a different industry than some of the local KAUs. Revision of industriesIn 2007 and 2008 the enterprises in Statistic Norway’s Central Register of Establishments and Enterprises have been coded in accordance with the new Standard Industrial Classification (SN2007). This has revealed some incorrectly classified enterprises and local KAUs. In such cases, the code according to the current standard (SN2002) has been revised. Transfers of enterprises have led to figures for internet service providers for 2007 that is not directly comparable to previous years. The new Standard Industrial Classification (SN2007) will be used for the first time in the publishing of preliminary figures for the statistical year of 2008, in October 2009. You will find descriptions of the classifications here |
Tables:
- Table 1 Post and telecommunications. Principal figures, by industry subclass. Local kind-of-activity units. 2004-2007
- Table 2 Post and telecommunications. Principal figures, by number of persons employed and industry group. Local kind-of-activity units. 2007
- Table 3 Post and courier activities (NACE 64.1). Principal figures, by county. Local kind-of-activity units. 2006-2007
- Table 4 Telecommunications (NACE 64.2). Principal figures, by county. Local kind-of-activity units. 2006-2007
- Table 5 Post and telecommunications. Principal figures, by industry subclass. Enterprises. 2004-2007
- Table 6 Post and telecommunications. Principal figures, by number of persons employed and industry group. Enterprises. 2007
The statistics is now published as Business statistics.
Contact
-
Statistics Norway's Information Centre
E-mail: informasjon@ssb.no
tel.: (+47) 21 09 46 42