Content
Published:
This is an archived release.
Innovation expenditure of almost NOK 60 billion in 2014
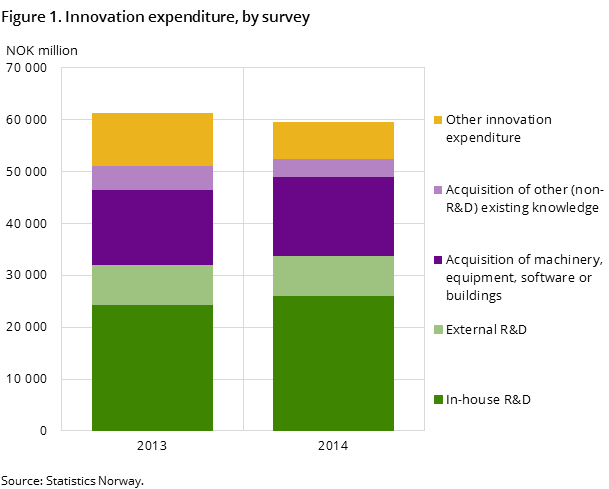
Norwegian enterprises reported innovation expenditure of NOK 59.7 billion in 2014. In the same year, 5.9 per cent of the enterprises’ combined turnover came from product innovations introduced during the three-year period from 2012-2014.
| 2012-2014 | 2014 | |||
|---|---|---|---|---|
| Per cent of all enterprises 5+ persons employed | Per cent of product innovators’ turnover | 1000 NOK | ||
| Innovation activity (product/ process) | Product innovation | Turnover from product innovations | Total innovation expenditures | |
| All industries | 40 | 27 | 11.0 | 59 726 002 |
| Manufacturing | 44 | 28 | 18.6 | 17 107 352 |
| Services | 42 | 30 | 15.2 | 33 234 170 |
| Other services | 26 | 11 | 2.2 | 9 384 480 |
| Size of enterprise | ||||
| 5-9 persons employed | 37 | 24 | 32.7 | 5 062 221 |
| 10-19 persons employed | 43 | 31 | 21.6 | 5 655 920 |
| 20-49 persons employed | 37 | 23 | 18.0 | 10 442 923 |
| 50-99 persons employed | 43 | 29 | 23.7 | 6 822 360 |
| 100-199 persons employed | 52 | 37 | 18.5 | 6 095 588 |
| 200-499 persons employed | 56 | 37 | 17.2 | 8 146 197 |
| 500 persons employed and more | 74 | 55 | 5.6 | 17 500 792 |


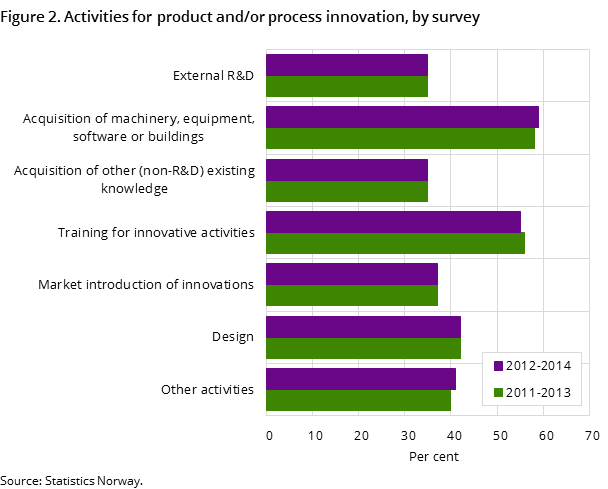
The overall level of product and/or process innovation activity (PP innovation activity) was unchanged in the period 2012-2014 compared to the previous 2011-2013 period. In-house research and development (R&D) was the most common work undertaken, reported by 65 per cent of the PP innovation active enterprises with a total of NOK 26.2 billion. Thirty-five per cent purchased R&D services from others, at a cost of roughly NOK 7.5 billion. In total, these R&D expenditures account for 56.5 per cent of the overall innovation expenditure.
Acquisition of existing knowledge (non-R&D) from other enterprises or organisations was also done by 35 per cent of the PP innovation active enterprises, at a total cost of NOK 3.3 billion. Acquisition of machinery, equipment, software or buildings for innovation activities was the second most common task undertaken during the period – with 58 per cent of the enterprises reporting this – at an aggregate cost of more than NOK 15 billion in 2014. The rest of the innovation activities surveyed are not broken down into separate expenditure categories, but overall these activities – including design, training for innovative activities, market introduction of innovations and all other costs ¬– were reported totalling NOK 7.2 billion.
Innovation expenditure varies between industries
Innovation expenditure measured as a share of turnover accounted for 2.4 per cent of the PP innovation active enterprises’ turnover and 1.6 per cent of the total turnover for all enterprises covered by the survey regardless of innovation status. In absolute numbers, this equates to NOK 59.7 billion in 2014; a small decrease from NOK 61.3 billion in 2013. The decrease can mainly be attributed to a roughly 30 per cent reduction in the reported expenditures in the acquisition of other external knowledge and the other expenditure categories. This accounts for decreased expenditure of more than NOK 4 billion; an amount that is not offset by the increase in the categories of in-house R&D and acquisition of machinery, equipment (etc.) since 2013.
However, it should be noted that given the statistical model uncertainty of the survey along with other quality considerations, we are not able to state that the 2013 and 2014 results are substantially different from each other. Given that 2013 is also the only previous data point, we cannot identify a trend in the results either way.
When breaking down the data by main industry groupings, the results show more or less unchanged expenditure in the manufacturing industries. Expenditures were lower in the service industries than in the previous survey, while increasing somewhat in other industries. In absolute figures, the service industries had almost twice as high innovation expenditure as the manufacturing industries, with NOK 33 and 17 billion respectively. Enterprises in the other industries group had total expenditures of slightly more than NOK 9 billion. Conversely, as a share of PP innovation active enterprises’ turnover, both the manufacturing and service industries invested equally in their innovation activities, both with 3.2 per cent of their turnover. For other enterprises; a grouping that includes the extraction of oil and gas, this share was notably lower at 1 per cent.
Breaking the data down further by detailed industry reveals large variations in the respective industries’ expenditures, both in absolute numbers and as a share of turnover. Unsurprisingly, it is scientific research and development that shows the highest share, with more than 70 per cent of the total turnover being designated as innovation expenditure. In the innovation survey, this industry consists almost exclusively of enterprises conducting business enterprise-targeted R&D and producing R&D services. Among industries with at least NOK 50 billion in turnover in 2014, computer programming and consultancy stands out with almost NOK 5 billion in innovation expenditures, which is a 7 per cent share of the total turnover.
At the opposite end of the spectrum, the survey shows that the four largest industries in the survey in terms of turnover – together accounting for 57 per cent of the total turnover in the survey ¬– all have significantly lower expenditures than average as a share of the total turnover. These industries include Mining and quarrying (incl. extraction of oil and gas), Wholesale trade, Financial and insurance activities, and Construction. These industries spent in the range of 0.4 to 0.8 per cent of their total turnover on PP innovation activities in 2014. Regardless of this, all these industries spend relatively large amounts compared to most of the smaller industries. Even in construction, where innovation expenditure as a share of turnover is lowest, the expenditure amounted to over NOK 1 billion in 2014.
A decrease in the share of turnover from product innovations
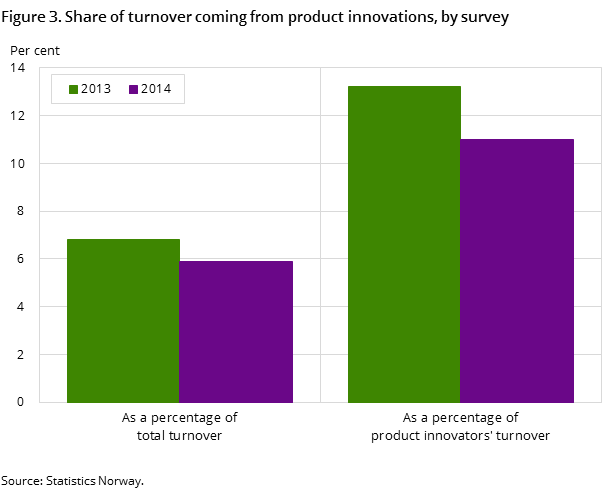
The share of the enterprises’ turnover in 2014 from new or significantly improved goods and services (product innovations) that were introduced to the market during the preceding three-year period was slightly lower in 2014 compared to 2013. This applies both as a share of the total turnover of all enterprises covered by the survey – down from 6.8 to 5.9 per cent – and as a share of turnover for the enterprises with product innovations only, which declined from 13.2 to 11 per cent. All main enterprise groups show a decrease from 2013 to 2014, but the differences are not particularly large in any of them and there are large in-group variations between the more detailed industries.
The decline is primarily caused by product innovators on average reporting a smaller percentage share of their turnover from product innovations than they did in the previous survey for product innovations that were only new to the enterprise. Innovations that were new to the enterprises’ markets have only marginally changed between the two surveys. This trend then carries through when the turnover shares are combined with the enterprises’ actual turnover and aggregated. It is possible for the average reported share to behave differently than the final share when turnover is accounted for due to either changes in the number of innovators or changes in the innovators’ turnover – i.e. if the product innovators’ turnover rises more than the reported average share decreases or vice versa – but overall this is not the case in the 2014 figures.
Data quality and statistical uncertaintyOpen and readClose
The survey covers the entire manufacturing sector as well as large parts of the service sector and other selected industries. It is carried out in the form of a representative sample survey of enterprises with between 5 and 49 employees. There is complete coverage of enterprises with more than 50 employees.
Due to the sampling, there is an inherent statistical uncertainty attached to the results. The uncertainty is greater for the size groups containing small enterprises than it is for the larger ones. Comparisons over time for the detailed industry breakdowns should also be made with some caution, especially for industries with relatively few enterprises in the population.
Few enterprises behind most changes Open and readClose
The innovation expenditures show a highly skewed distribution. Most enterprises report relatively low numbers, while only some have very large investments. It is not necessarily the case that these should be constant over time, especially for non-R&D expenditures. Product turnaround varies between industries and enterprises, and large investments in any given year are not necessarily expected to be repeated. Often quite the opposite. For the more detailed aggregates, most large swings will be the result of a very small number of observations rather than a uniform shift. Such changes may also result from enterprises closing, merging or simply altered coding of industry affiliation and/or size group.
Comparability over timeOpen and readClose
Due to a methodological change in the data collection, results from the Norwegian innovation survey for 2012-2014 represents a break in the data series. As such, they are not directly comparable to previously published results for the period 2001-2012. The reference level for the current data series is the results from an “off cycle” innovation survey carried out for the years 2011-2013. Both periods are available in the StatBank. An article in English outlining the background for this change is available in the OECD Statistics Newsletter no. 60.
Contact
-
Lars Wilhelmsen
E-mail: lars.wilhelmsen@ssb.no
tel.: (+47) 40 90 24 35
