Content
Published:
This is an archived release.
Half of Norwegian enterprises are innovative
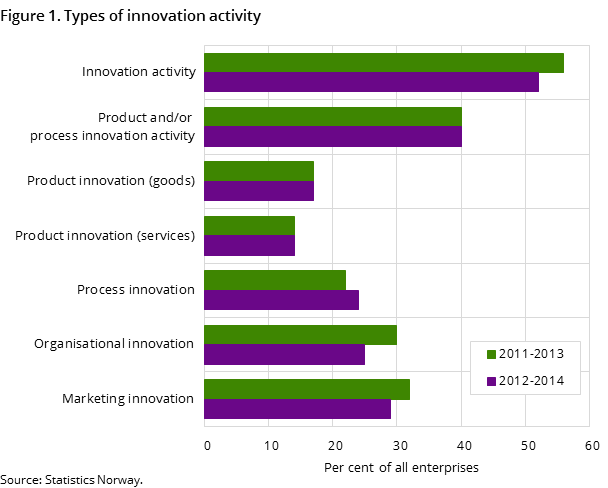
Fifty per cent of the enterprises covered by the Norwegian innovation survey introduced one or more forms of innovation during the three years from 2012 to 2014. This is a decrease of three percentage points compared to the period 2011-2013.
| 2012-2014 | |||||
|---|---|---|---|---|---|
| Per cent of all enterprises | |||||
| Innovation activity (product/process) | Product innovation | Process innovation | Marketing innovation | Organisational innovation | |
| All industries | 40 | 27 | 24 | 29 | 25 |
| Manufacturing | 43 | 28 | 26 | 27 | 23 |
| Services | 42 | 30 | 25 | 33 | 27 |
| Other services | 27 | 11 | 17 | 15 | 24 |
| Size of enterprise | |||||
| 5-9 persons employed | 37 | 24 | 22 | 28 | 20 |
| 10-19 persons employed | 43 | 31 | 25 | 32 | 26 |
| 20-49 persons employed | 37 | 23 | 21 | 26 | 26 |
| 50-99 persons employed | 43 | 29 | 28 | 27 | 27 |
| 100-199 persons employed | 51 | 37 | 32 | 33 | 37 |
| 200-499 persons employed | 56 | 37 | 39 | 31 | 43 |
| 500 persons employed and more | 73 | 54 | 51 | 41 | 57 |


The Norwegian innovation survey measures four main types of innovation: product innovation, process innovation, organisational innovation and marketing innovation. There were no large differences in the incidence of the different innovation types. Twenty-seven per cent of the enterprises introduced product innovations, while 24 per cent introduced process innovations. Organisational and marketing innovations were introduced by 25 and 29 per cent of the enterprises respectively.
In addition, 2 per cent reported having undertaken innovation activities to introduce product or process innovation, but that these activities had either been abandoned before completion or were still ongoing at the end of the observation period without having yielded an innovation in the enterprise.
Compared to the period from 2011 to 2013, there is no change in the share of product innovators, while process innovation is up two percentage points. Both organisational innovation and marketing innovation decreased somewhat; most markedly for organisational innovation, which is down five percentage points.
Taking the error margin of the survey into account, the incidence of product and process innovation amongst the enterprises is not substantially different from the previous survey. The share of enterprises with organisational or marketing innovations has gone down somewhat, particularly among enterprises that did not also introduce product and/or process innovations.
Most product and process innovations are developed in-house
Most product and/or process innovators report developing innovations in-house. This is the case for both types of innovation, but in-house development is more common for products than for processes. For product and/or process innovators overall, 67 per cent reported that at least one of these innovations was primarily developed in-house. Forty-three per cent had introduced innovations that were developed in co-operation with enterprises in the same enterprise group or in co-operation with other enterprises or institutions. Twenty-nine per cent introduced innovation that had primarily been developed by others or that was originally developed by others and subsequently modified by the enterprise.
Many product innovations are new to the enterprises’ market
Introducing innovations that were new to the enterprises’ market and innovations that were new only to the enterprise was equally common amongst product innovators, with 65 per cent of the enterprises for each. Accordingly, almost 17 per cent of all enterprises introduced products that were new to their market. Amongst these, 76 per cent reported innovations new to the Norwegian market, 29 per cent said that they had innovations new to the European market, and 34 per cent answered that at least one of their innovations was new to the world market. Amongst process innovators, the share of innovators who said they had innovations that were new to the market was 34 per cent.
Enterprises with technological innovation activity have broader markets
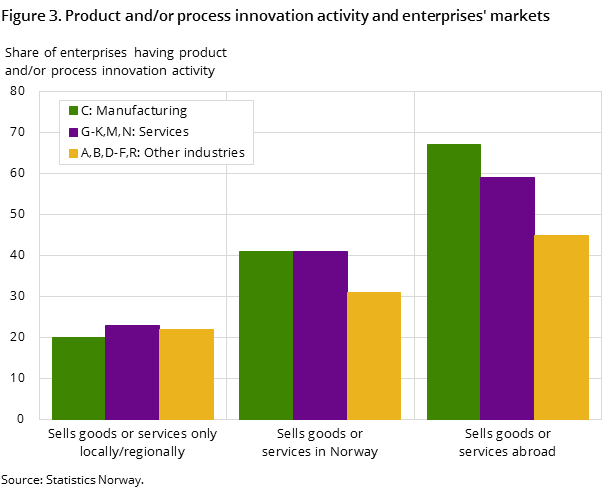
Enterprises that operate in more expansive markets have a higher chance of introducing product and/or process innovations. Enterprises that sell their goods or services throughout Norway have twice the incidence of innovation as those that only sell locally or regionally. Enterprises that (also) sell goods or services to foreign markets further increase the share of innovators by another 50 per cent.
This increase in the share of innovators occurs regardless of enterprise size. Even a small enterprise with 5-9 employees that operates internationally has a much higher likelihood of being innovative than a large one with more than 500 employees that only sells its goods or services to a local or regional market. The same trend is present in all three of the main industry groupings but is strongest in the manufacturing industries.
Co-operation with the public sector is of relatively low importance
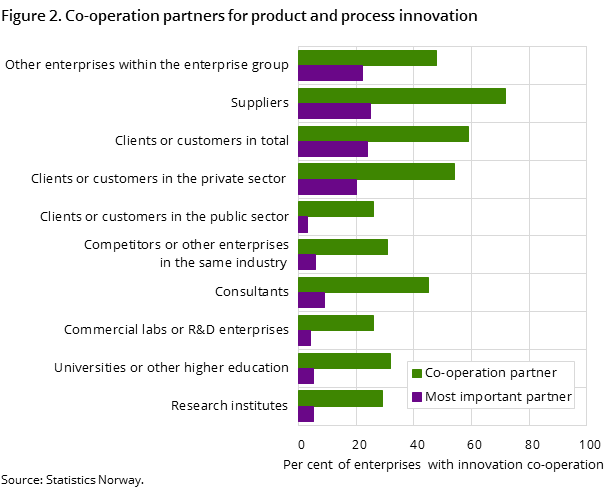
Suppliers are the partner most used for co-operation on product and process innovation activities and this is also the type of partner most enterprises consider to be most important. As a share of enterprises that co-operated with a given partner, other enterprises in the same enterprise group are most often reported to be the most important partner. Considering that not all enterprises belong to an enterprise group, other enterprises in the same group are the most frequently used partner and likely to be the most important partner for enterprises that are connected in such a way.
Clients and customers are the second most common co-operation partner and the second most reported as the most important. Before 2012, the survey did not separate between private and public sector clients and customers. Considering these individually, private sector customers are still the second most frequent type of co-operation partner. Co-operation with clients or customers in the public sector occurs about half as often and is also less likely to be important. Amongst enterprises that had these types of co-operation, 37 per cent said that co-operation with private sector clients or customers was most important, while only 12 per cent of those who co-operated with clients or customers in the public sector reported this to be most important. Among the different types of partners, innovation co-operation with public sector clients or customers is least likely to occur and least likely to be reported as most important when it does occur.
Non-innovators rarely consider barriers to innovation as relevant
When enterprises without innovation or innovation activity were asked why they did not engage in any innovation activities, 94 per cent responded that they had no need or no compelling reason to innovate. Only 6 per cent stated that they considered innovating but had encountered barriers to innovation that prevented them from doing so.
When asked for further details, 25 per cent of the former group answered that earlier innovations in the enterprise was a very (or somewhat) important reason for this. Thirty per cent of the enterprises that said they had no compelling reason to innovate only cited reasons such as low demand, lack of competition or a lack of good ideas as reasons. Almost a third were not able to state any particular reason, reporting all the options as being of no importance.
This result indicates that there is a cognitive gap between innovators and non-innovators, where the latter, to a large degree, lacks the ability to identify both opportunities and challenges when it comes to innovation. This may be their largest barrier to change, and is a result that corresponds well with findings from previous surveys: innovators were much more likely to report on factors that were important in hampering or hindering their innovation activities than non-innovators.
The government supports one in three technological innovators
Thirty-two per cent of enterprises with product and/or process innovation activity report having received some form of public financial support towards the development of their innovations. Financial support from central government or national governmental institutions is reported by 27 per cent, while 13 per cent say that they received support from local or regional government or institutions. Public funding from the European Union, including the 7th Framework Programme for Research and Technical Development the Horizon 2020 Programme for Research and Innovation, is relatively rare. Only 2 per cent report having received EU financial support.
Public procurement contracts lead to innovation for one in five enterprises
Twenty-eight per cent of all enterprises reported that they had contracts to provide goods or services to either Norwegian or foreign public sector organisations. The same share of enterprises had such contracts with the Norwegian public sector, while 3 per cent delivered goods or services to the foreign public sector. Very few enterprises had procurement contracts with foreign public sector organisations only. Among enterprises that had public procurement contracts, 10 per cent reported that innovation was required as a part of the contract. Twelve per cent reported a contract that otherwise led to innovation activity in the enterprise as a result of the delivery.
Overall, almost 6 per cent of Norwegian enterprises have engaged in some form of innovation activity due to having contracts to deliver goods or services to the public sector.
Data quality and statistical uncertaintyOpen and readClose
The survey covers the entire manufacturing sector as well as large parts of the services sector and other selected industries. It is carried out in the form of a representative sample survey of enterprises with between 5 and 49 employees. There is complete coverage of enterprises with more than 50 employees.
Due to the sampling, there is an inherent statistical uncertainty attached to the results. The uncertainty is greater for the size groups containing small enterprises than it is for the larger ones. Comparisons over time for the detailed industry breakdowns should also be made with some caution, especially for industries with relatively few enterprises in the population.
Comparability over timeOpen and readClose
Due to a methodological change in the data collection, results from the Norwegian innovation survey for 2012-2014 represents a break in the data series. As such, they are not directly comparable to previously published results for the period 2001-2012. The reference level for the current data series is the results from an “off cycle” innovation survey carried out for the years 2011-2013. Both periods are available in the StatBank. An article in English outlining the background for this change is available in the OECD Statistics Newsletter no. 60.
Contact
-
Lars Wilhelmsen
E-mail: lars.wilhelmsen@ssb.no
tel.: (+47) 40 90 24 35
