Content
Published:
This is an archived release.
Increased turnover from innovative products
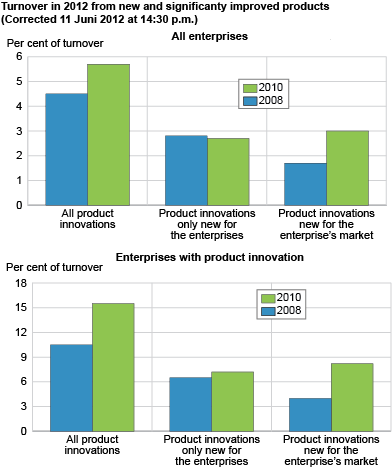
The share of turnover originating from new or significantly improved products grew by 1.2 percentage points from 2008 to 2010. This was primarily the result of increased turnover from products that were new to the market. Products new only to the enterprise remained relatively stable.
Despite the fact that the share of product innovators dropped from 21 to 19 per cent compared to the previous survey, the enterprises’ share of turnover coming from product innovations increased from 4.5 per cent in 2008 to 5.7 per cent in 2010.
This indicates that product innovations had an increased importance for revenue amongst innovators during the period. Considering only product innovative enterprises, the share of turnover from new or significantly improved products rose from 10.5 to 15.5 per cent. This was primarily driven by the share of products that were new to the enterprises’ markets more than doubling; going from 4 to 8.2 per cent. In absolute terms, the growth in innovative revenue was in excess of NOK 24 billion; an increase of 16.4 per cent since 2008.
Some increase in total innovation expenditure
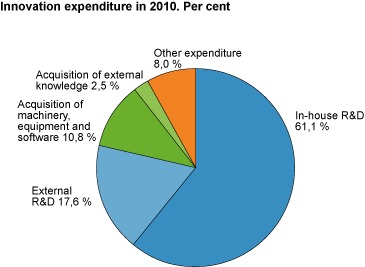
Meanwhile, the enterprises’ overall innovation expenditure rose from NOK 27.2 billion in 2008 to NOK 29 billion in 2010. The change was primarily caused by an increase in the reporting of Acquisition of machinery , equipment and software to NOK 3.1 billion and of Other expenditure to NOK 2.3 billion. Other expenditure includes Training for innovative activities , Market introduction of innovations and Design , as well as other non-specified costs incurred for product and process-related innovation activities.
Expenditures for In - house R & D and for External R & D were reported as being only marginally higher than in 2008, at NOK 17.7 and 5.1 billion respectively. In fixed prices this is a nominal decrease since 2008. Expenditure for the Acquisition of external knowledge increased somewhat, bringing the total above NOK 700 million, but this category was markedly the lowest reported amongst the expenditure categories - as it also was in the previous survey. Overall, R&D costs - both internal and external - still dominate the picture, but the share of innovation expenditure not classed as R&D did increase from 17 to 21.3 per cent.
|
For the present survey, Statistics Norway has put extra resources into ensuring the quality of the enterprises’ reporting of innovation expenditure (other than R&D). These efforts have contributed to the reported increase compared to the previous survey. The results from this work also show that many enterprises have considerable difficulties extracting and separating such expenses from those of the day-to-day running of their operations. Thus, there is a tendency towards enterprises with some level of innovation activities underreporting, or not reporting, the relevant expenditure figures. This underreporting is estimated to add 2-4 per cent on top of the numbers published in this release. Additionally, there may be certain larger investments that are not reported as innovation expenditure at all due to different levels of awareness and understanding of the innovation concept among the respondents. |
In enterprises with at least 10 employees, innovation expenditure amounted to exactly one per cent of turnover. For manufacturing the number was 1.6 per cent, in services 1.2 per cent, and in other industries 0.4 per cent of turnover. However, on a more detailed level, this varies considerably between the individual industries. Furthermore, the Norwegian business enterprise sector is dominated by industries where the ratio of innovation expenditure to turnover is relatively low. All the individual industry aggregates with a recorded turnover of more than NOK 100 billion in 2010 were below average, and together these industries represent almost 74 per cent of total revenue but only 30 per cent of innovation expenditure.
Significant differences in creativity skills
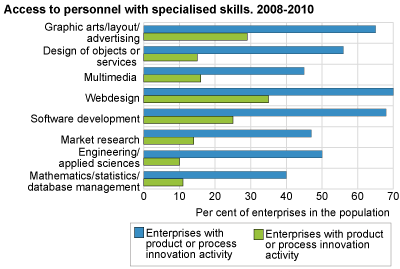
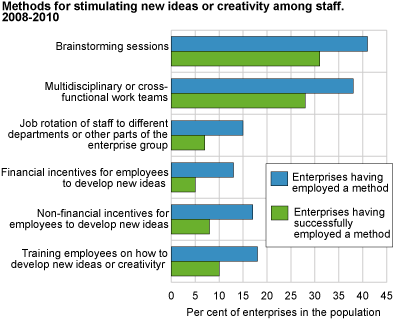
In addition to the standard battery of questions, the Norwegian innovation survey for 2010 also contained an ad-hoc module designed to gauge the respondents’ access to personnel with specialised innovation-related skills and the use of different methods to enhance creativity within the enterprise.
The results show a clear difference between enterprises with product or process-related innovation activities (PP innovation active enterprises) and other enterprises in relation to the degree of access to personnel with specialised skills - either as employees of the enterprise or obtained from external sources. For the entire business enterprise sector put together, PP innovation active enterprises were, depending on the individual skill, between two and five times more likely to have access to such specialised personnel.
The degree of access to the different types of skills does vary considerably between industries, and - in particular for enterprises without PP innovation activity - to some degree also by enterprise size. There are also differences between industries concerning what skills are most frequently employed and the degree of difference between PP innovation active and other enterprises. Even so, the tendency is almost exclusively that all types of skills are more frequently available amongst innovators, regardless of industry and enterprise size.
A similar trend is almost as apparent with regard to the use of methods to simulate new ideas or creativity among staff. While both PP innovation active enterprises and non-innovators are likely to prefer the same methods - Brainstorming sessions and Multidisciplinary or cross - functional work teams are the most frequently reported methods for both groups while Financial incentives for employees to develop new ideas are the least common - the PP innovation active enterprises have a two to three times higher likelihood of using them. Moreover, enterprises with PP innovation activity also enjoy a greater success rate than the non-innovators. The success rate is defined as the share of enterprises that used a given method and that also reported that it was successful.
About the dataThe Norwegian survey on the innovation activity in the business enterprise sector, conducted by Statistics Norway, is part of the Eurostat Community Innovation Survey (CIS). The data discussed in this release are part of the seventh CIS survey (CIS 2010). The survey covers the entire manufacturing sector and large parts of the services sector along with other selected industries. The survey is in the form of a representative sample survey of enterprises with between 5 and 49 employees (20-49 in NACE groups G and H), with the addition of complete coverage of enterprises with more than 50 employees. Due to the CIS being in part a sample survey, there is an inherent statistical uncertainty to the results. The uncertainty attached to the groups with the smaller enterprises is greater than for the larger enterprise groups. The data included in this release cover only a subset of the questions in the CIS 2010 questionnaire. A complete set of tables including all variables broken down by detailed enterprise type and size group/sector is available (in Norwegian) by contacting Statistics Norway . |
Tables:
- Table 1 Types of innovation activity, by main industry and size group. 2008-2010
- Table 2 Innovation expenditures in 2010, by main industry and size group.
- Table 3 Turnover from new or improved products in 2010, by main industry and size group
- Table 4 Employment of personell with specific skills, PP-innovation active enterprises, by main industry and size group. 2008-2010
- Table 5 Employment of personell with specific skills, enterprises without PP-innovation activity, by main industry and size group. 2008-2010
- Table 6 Methods to stimulate new ideas or creativity among staff, PP-innovation active enterprises, by main industry and size group. 2008-2010
- Table 7 Methods to stimulate new ideas or creativity among staff, enterprises without PP-innovation activity, by main industry and size group. 2008-2010.
Contact
-
Lars Wilhelmsen
E-mail: lars.wilhelmsen@ssb.no
tel.: (+47) 40 90 24 35


