Content
Published:
This is an archived release.
Private broadband speed doubled in two years
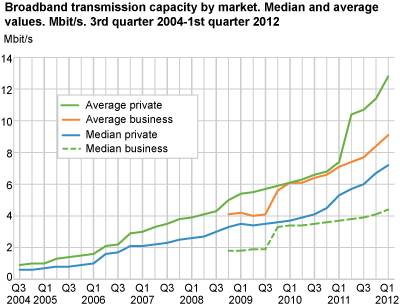
Following a new substantial increase in the last quarter, the capacity of fixed private broadband accesses has doubled in the last two years. The number of fixed private broadband subscriptions continues to increase at a speed of 1 per cent per quarter.
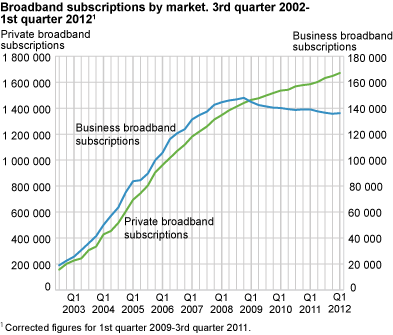
86 000 more private fixed broadband subscriptions in a year
The number of private broadband subscriptions with fixed access on the Norwegian mainland was 1 671 000 at the end of the 1st quarter of 2012; an increase of 86 000 subscriptions in the last 12 months. Compared to the previous quarter, this is an increase of 23 000 subscriptions.
The number of business subscriptions remains at 136 000; the same as the previous quarter.
New increase in broadband capacity
The average transmission capacity for fixed private broadband has increased to 12.8 from 11.4 Mbit/s in the previous quarter. At the same time, the median value has increased to 7.2 Mbit/s compared to 6.7 in the previous quarter.
The average transmission capacity for fixed business broadband has increased to 9.1 from 8.4 Mbit/s in the previous quarter. At the same time, the median value has increased to 4.4 Mbit/s compared to 4.1 in the previous quarter.
Private broadband subscriptions with a capacity of more than 8 Mbit/s total 46 per cent; an increase from 44 per cent in the previous quarter. Only 29 per cent of business broadband subscriptions have this capacity; an increase from 26 per cent in the previous quarter.
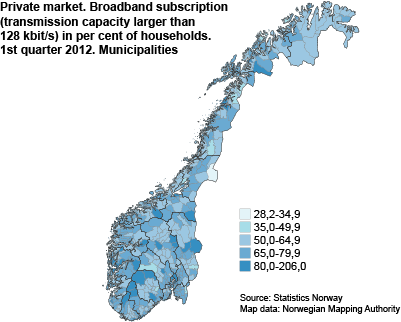
The broadband penetration rate in private households is 75 per cent. Due to new household figures, this is the same percentage as in the previous quarter. Compared to last year there is an increase from 72 per cent. The figure for private broadband subscriptions per 100 households varies between 82 per cent in the county of Oslo and 63 per cent in the county of Finnmark.
| Centrality1 | Broadband subscriptions | Broadband subscriptions as a percentage of households | |||||||||||||||||||||||||||||||||||||||||||||||||||||||||||||||||||||||||||||
|---|---|---|---|---|---|---|---|---|---|---|---|---|---|---|---|---|---|---|---|---|---|---|---|---|---|---|---|---|---|---|---|---|---|---|---|---|---|---|---|---|---|---|---|---|---|---|---|---|---|---|---|---|---|---|---|---|---|---|---|---|---|---|---|---|---|---|---|---|---|---|---|---|---|---|---|---|---|---|---|
| Remote municipalities | 133 712 | 66 | |||||||||||||||||||||||||||||||||||||||||||||||||||||||||||||||||||||||||||||
| Fairly remote municipalities | 91 008 | 70 | |||||||||||||||||||||||||||||||||||||||||||||||||||||||||||||||||||||||||||||
| Fairly central municipalities | 269 748 | 71 | |||||||||||||||||||||||||||||||||||||||||||||||||||||||||||||||||||||||||||||
| Central municipalities | 1 176 273 | 77 | |||||||||||||||||||||||||||||||||||||||||||||||||||||||||||||||||||||||||||||
| 1 | 1 Centrality 2008, Municipalities 2008. |
The most central municipalities have the highest number of broadband subscriptions relative to the number of households. While the number of broadband subscriptions relative to the number of households is 77 per cent, the corresponding figure for less central municipalities is 66 per cent.
| Municipalities | Broadband subscriptions as a percentage of households | ||||||||||||||||||||||||||||||||||||||||||||||||||||||||||||||||||||||||||||||
|---|---|---|---|---|---|---|---|---|---|---|---|---|---|---|---|---|---|---|---|---|---|---|---|---|---|---|---|---|---|---|---|---|---|---|---|---|---|---|---|---|---|---|---|---|---|---|---|---|---|---|---|---|---|---|---|---|---|---|---|---|---|---|---|---|---|---|---|---|---|---|---|---|---|---|---|---|---|---|---|
| Average for all municipalities | 74.7 | ||||||||||||||||||||||||||||||||||||||||||||||||||||||||||||||||||||||||||||||
| 0941 Bykle | 206.0 | ||||||||||||||||||||||||||||||||||||||||||||||||||||||||||||||||||||||||||||||
| 0817 Drangedal | 99.7 | ||||||||||||||||||||||||||||||||||||||||||||||||||||||||||||||||||||||||||||||
| 1046 Sirdal | 98.5 | ||||||||||||||||||||||||||||||||||||||||||||||||||||||||||||||||||||||||||||||
| 1241 Fusa | 98.0 | ||||||||||||||||||||||||||||||||||||||||||||||||||||||||||||||||||||||||||||||
| 1232 Eidfjord | 97.8 | ||||||||||||||||||||||||||||||||||||||||||||||||||||||||||||||||||||||||||||||
| 0215 Frogn | 96.2 | ||||||||||||||||||||||||||||||||||||||||||||||||||||||||||||||||||||||||||||||
| 1640 Røros | 95.3 | ||||||||||||||||||||||||||||||||||||||||||||||||||||||||||||||||||||||||||||||
| 1151 Utsira | 94.6 | ||||||||||||||||||||||||||||||||||||||||||||||||||||||||||||||||||||||||||||||
| 1121 Time | 92.8 | ||||||||||||||||||||||||||||||||||||||||||||||||||||||||||||||||||||||||||||||
| 0521 øyer | 92.2 | ||||||||||||||||||||||||||||||||||||||||||||||||||||||||||||||||||||||||||||||
| 0940 Valle | 90.9 | ||||||||||||||||||||||||||||||||||||||||||||||||||||||||||||||||||||||||||||||
| 1828 Nesna | 90.9 | ||||||||||||||||||||||||||||||||||||||||||||||||||||||||||||||||||||||||||||||
| 0213 Ski | 90.7 | ||||||||||||||||||||||||||||||||||||||||||||||||||||||||||||||||||||||||||||||
| 0834 Vinje | 89.0 | ||||||||||||||||||||||||||||||||||||||||||||||||||||||||||||||||||||||||||||||
| 0544 øystre Slidre | 88.5 | ||||||||||||||||||||||||||||||||||||||||||||||||||||||||||||||||||||||||||||||
| 0926 Lillesand | 87.7 | ||||||||||||||||||||||||||||||||||||||||||||||||||||||||||||||||||||||||||||||
| 0216 Nesodden | 87.5 | ||||||||||||||||||||||||||||||||||||||||||||||||||||||||||||||||||||||||||||||
| 1563 Sunndal | 86.6 | ||||||||||||||||||||||||||||||||||||||||||||||||||||||||||||||||||||||||||||||
| 0217 Oppegård | 86.5 | ||||||||||||||||||||||||||||||||||||||||||||||||||||||||||||||||||||||||||||||
| 0230 Lørenskog | 86.1 | ||||||||||||||||||||||||||||||||||||||||||||||||||||||||||||||||||||||||||||||
| 1601 Trondheim | 86.1 | ||||||||||||||||||||||||||||||||||||||||||||||||||||||||||||||||||||||||||||||
| 1018 Søgne | 85.7 | ||||||||||||||||||||||||||||||||||||||||||||||||||||||||||||||||||||||||||||||
| 0520 Ringebu | 84.1 | ||||||||||||||||||||||||||||||||||||||||||||||||||||||||||||||||||||||||||||||
|
The mobile broadband access was removed because this part of the statistics is not complete and because these subscriptions cannot be distributed geographically and by download capacity in the same way as the fixed access subscriptions. The Norwegian Post and Telecommunications Authority also compiles statistics on these mobile subscriptions but without information about the geographical location or download capacity. The number of Internet service providers reporting to this survey has been around 200 over the past few years. Market changes have reduced this number to around 180. A few small, but locally important Internet service providers, mostly cable TV providers, are still not included in the survey. Efforts have been made to include these providers. Some small errors related to the distribution of subscribers between municipalities may occur. This can have major consequences for the figures per household for some municipalities. The number of households for 2011 has been used in these statistics. Individuals and businesses can have several Internet subscriptions and several individuals can use the same subscription. The number of subscriptions is therefore not equivalent to the number of households/businesses with Internet access. A household can for instance get Internet access through an employer, educational institution or by sharing access with other households. The survey ICT in households provides more information about households with at least one member under the age of 75 with Internet access. The Norwegian Post and Telecommunications Authority collects different kinds of data for its Telecom statistics, i.e. numbers of fixed broadband subscriptions in the business and private markets. While the Internet Survey divides the subscriptions by municipality and transmission capacity, the Norwegian Post and Telecommunications Authority collects information about access technology. The total figures should be close to identical. See statistics compiled by The Norwegian Post and Telecommunications Authority . For more information, see About the statistics . |
Tables:
- Table 1 Private broadband subscriptions. Subscription by transmission capacity and county including Svalbard. 1st quarter of 2012
- Table 2 Business broadband subscriptions. Subscription by transmission capacity and county including Svalbard. 1st quarter of 2012
- Table 3 Development features. Broadband subscription by market. Active subscriptions only. The whole country without Svalbard
- Table 4 Broadband subscriptions (larger than 128 kbit/s). Business and private subscriptions. 1st quarter 2012. Municipality
Contact
-
Statistics Norway's Information Centre
E-mail: informasjon@ssb.no
tel.: (+47) 21 09 46 42