High growth in R&D in businesses continues
Published:
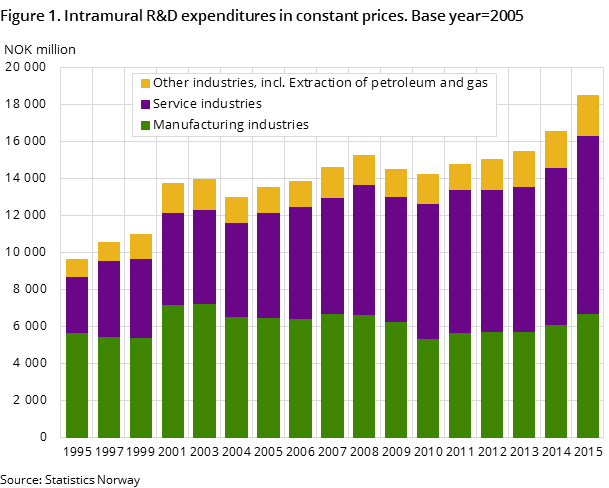
The business enterprise sector performed research and development (R&D) for about NOK 28.1 billion in 2015. This is 13 per cent higher than in 2014. At constant prices, the increase was 10 per cent.
- Full set of figures
- Research and development in the business enterprise sector
The preliminary figures for 2015 show that 19 500 R&D man-years were performed; 9 per cent more than in 2014. This is the second consecutive year with a strong increase in business enterprises’ R&D activity. The other years following 2010 have also seen real growth, but to a lesser extent. The increase for 2015 took place during a period of moderate production development in general. Gross domestic product for Norway showed a decline in 2015, but the corresponding figure for mainland Norway showed an increase of about 3 per cent (nominal). This means that R&D expenditure as a share of total GDP increased by 0.11 percentage points to 0.9 per cent.
In addition to the total R&D expenditure of NOK 28.1 billion, enterprises with 5-9 employees performed R&D for around NOK 2.5 billion in 2015. About 2 000 R&D man-years were performed in these enterprises. The last time that enterprises with 5-9 employees were covered in the survey was in 2012. To ensure comparability over time, the rest of the figures in this release cover enterprises with at least 10 employees.
Strong increase for smaller enterprises
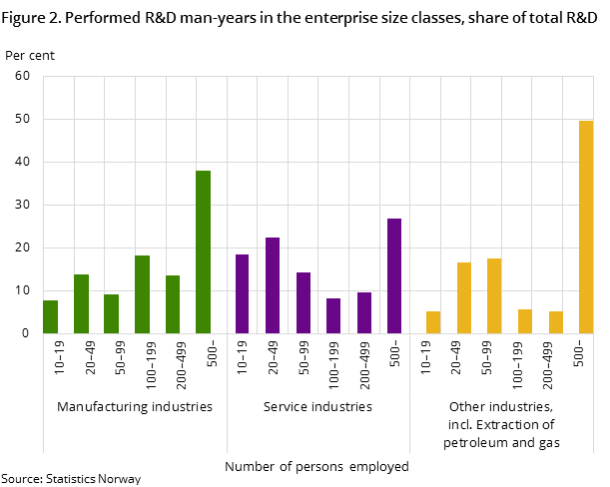
The results for 2015 also show a clear increase in the share of enterprises performing R&D. This share was stable at around 20 per cent for several years, but jumped to 25 per cent for all enterprises in 2015. In terms of the number of R&D enterprises, the growth is most remarkable for small enterprises with 10-50 employees. This group of enterprises also has the largest increase in expenditures for own R&D activity; 26 per cent more than in 2014. However, it is the largest enterprises that contribute the most to R&D overall.
The increase for the smaller enterprises may seem large, but corresponds reasonably well with the sharp increase in the use of the tax credit scheme for R&D (SkatteFUNN) in the last two years. This scheme is widely used by small enterprises. The number of approved applications to SkatteFUNN increased by 15 per cent in both 2014 and 2015. Budgeted R&D costs increased by nearly 25 per cent in both years.
Smaller enterprises most dominant in service industries
Service industries in particular have a large number of smaller R&D enterprises, and these contribute significant R&D efforts. Service enterprises with 10-50 employees spent NOK 5 billion on R&D expenditures in 2015, which is a third of the R&D expenditure within the service industries. By comparison, manufacturing enterprises contributed with nearly NOK 2 billion; a fifth of the industry's total R&D expenditure.
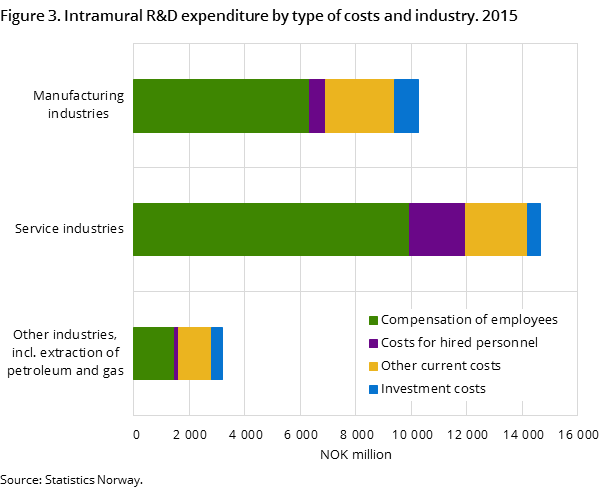
R&D expenditure in the service industries totalled NOK 14.6 billion; 14 per cent higher than the year before. The manufacturing R&D expenditure was NOK 10.3 billion. Growth was only 1 percentage point lower than for services, while the development in manufacturing was relatively weaker in the preceding years. Other industries (including extraction of petroleum and gas) performed R&D for NOK 3.2 billion; an increase of 10 per cent.
There is considerable variation in development among the individual enterprises, regardless of industry and size group, i.e. many enterprises report increased R&D activity while others have lower activity.
Increased use of hired R&D personnel
R&D activity in business enterprises is mainly carried out by the enterprises’ own employees. Compensation of employees amounted to NOK 17.7 billion in 2015, which corresponds to 63 per cent of the total R&D expenditure. Nevertheless, hiring external personnel to perform R&D in the enterprise is becoming more widespread. Costs of hired R&D personnel amounted to NOK 2.8 billion in 2015; NOK 700 million more than in 2014. This is a percentage growth of 36 per cent. In 2009, the cost of hired personnel was 6 per cent of the total R&D expenditure, and in 2015 the share increased to 10 per cent. There has been a gradual change over time, but the increase was clearly highest in 2015.
Service industries account for most of the business enterprises’ costs of hired R&D personnel, totalling NOK 2 billion in 2015. These industries also made the largest contribution to the growth in 2015. All group sizes showed growth, but the percentage change was largest among service enterprises with 10-50 employees.
The increase in the use of hired personnel is also in accordance with SkatteFUNN. Purchased labour costs in approved SkatteFUNN applications increased to 20 per cent of total budgeted R&D expenditures for 2015.
Norway's total R&D efforts
Information on total R&D efforts for Norway, including higher education institutions and research institutes, are available at http://www.nifu.no/en/statistikk/nokkeltall/.
Contact
-
Frank Foyn
-
Claudia Berrios
-
Harald Fondevik
-
Statistics Norway's Information Centre


