Content
Published:
This is an archived release.
Fewer social assistance recipients
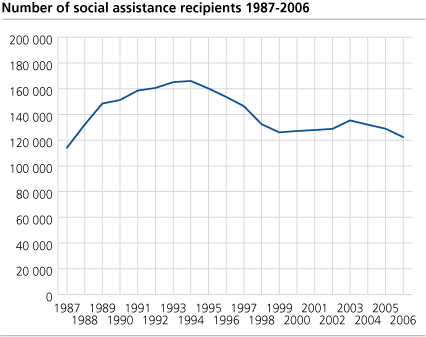
122 400 persons received a total of NOK 4.6 billion in social assistance in 2006. This is a slight decrease in both number of recipients and amount from 2005.
2.6 per cent of the Norwegian population received social assistance in 2006. Compared with 2005, the number of recipients fell 5 per cent, and the total payment (in fixed prices) decreased with 7 per cent.
Although the number of social assistance recipients fell, the distribution across the age groups receiving social assistance was unchanged from 2005. The largest age group of recipients was still aged 30-39 years - this group accounts for every fourth recipient. At the same time - the largest group of recipients as a proportion of the population was the 20-24 age group. 7 per cent in this age group received economic social assistance in 2006.
In average the recipients received benefits for 5.3 months in 2006 - the same average as in 2005. The social assistance recipients in 2006 received NOK 4.6 billion in total, or almost NOK 7 100 on average per person per month. The average payment per person per year was NOK 37 600.
Social services staff
At the end of 2006 there were 5 564 jobs in the social services. This figure includes positions related to the traditional social services tasks such as counseling, consultations, preventive work and work related to substance abusers.
There are large differences between the counties, but the average ratio of employees per 1 000 adults (aged 18 and above) is 1.6 full-time equivalents in 2006.
Tables:
- Table 1 Number of cases on social assistance, by age, county and size of municipality. 1987-2006
- Table 2 Expenditure on social assistance, by nature of assistance, county and size of municipality. 1986-2006. NOK in 2006
- Table 3 Average payments of social assistance per month on assistance. Figures of duration of benefit and family cycle phase. 2006. NOK
- Table 4 Recipients of social assistance by duration of benefit and family cycle phase. 2006
- Table 5 Recipients of social assistance by number of municipalities from which they have received payments and age. 2006
- Table 6 Recipients of social assistance, by main source of income and family cycle phase. 2006
- Table 7 Recipients of social assistance, by labour force status and family cycle phase. 2006
- Table 8 Recipients of social assistance by type of allowance and family cycle phase. 2006
- Table 9 Recipients of social assistance with or without immigrant background, by age. 2006
- Table 10 Man-years in social services per 31 December, by county. 2006
Contact
-
Unni Beate Grebstad
E-mail: unni.grebstad@ssb.no
tel.: (+47) 94 50 68 66


