30 per cent of sentences served using electronic monitoring
Published:
Adult men with a Norwegian citizenship are most frequently imprisoned in Norway, but more than half of those in custody were non-Norwegian citizens. Although this is relatively similar to recent years, far more people are serving their prison sentence under electronic monitoring (EM) outside of prison facilities.
- Full set of figures
- Imprisonments
- Series archive
- Imprisonments (archive)
Of the 4 103 prisoners at the beginning of 2014, 72 per cent were serving a prison sentence and 2 per cent were under preventive detention. Those serving a sentence for non-payment of a fine made up just over 1 per cent. The remaining 25 per cent were being held in custody.
Imprisonment given for different types of offences
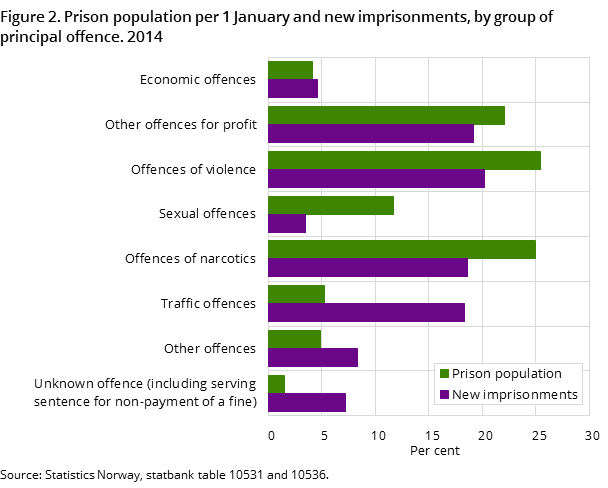
Four different groups of crime had almost the same number of imprisonments in 2014. Of the 11 458 new imprisonments, an offence of violence was the principal offence in somewhat more cases (2 319) than theft and other offences for profit (2 195), narcotic offences (2 128) and traffic offences (2 102).
Stable majority of men and inmates over 30 years
Among those who were imprisoned on 1 January 2014, 95 per cent were men. This is about the same share as in the previous twelve years. Of all imprisoned persons with known age, 67 per cent were over 30 years of age.
Of the inmates under 30 years of age at the beginning of the year, 59 per cent were serving a sentence for either other offences for profit or offences of violence as their principal offence. The corresponding share for those over 30 years of age was considerably smaller, with 43 per cent. Of the principal offence, this older age group is more frequently imprisoned for narcotic offences, economic offences and traffic offences than the younger groups.
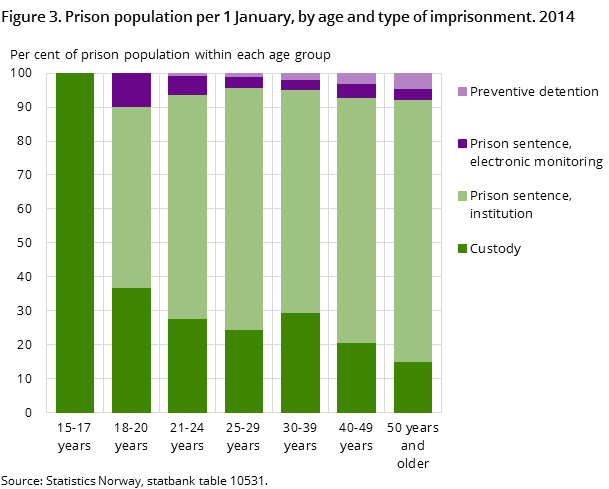
Very few persons under 18 years of age are imprisoned, and when 15-17 year-olds are imprisoned they are almost always held in custody – as shown in figure 3.
Seven out of ten are Norwegian citizens
Of those imprisoned on 1 January 2014 with a known citizenship, more than 68 per cent were Norwegian citizens. Furthermore, 19 per cent held a citizenship from another European country, while those holding a citizenship from an African country made up 7 per cent.
Among the total 1 276 non-Norwegian citizens imprisoned at the beginning of the year, 60 per cent held a citizenship from another European country. Of this group of 771 persons, just over half held either a citizenship from Poland (167), Lithuania (126) or Romania (116).
Norwegians serving sentences; non-Norwegians held in custody
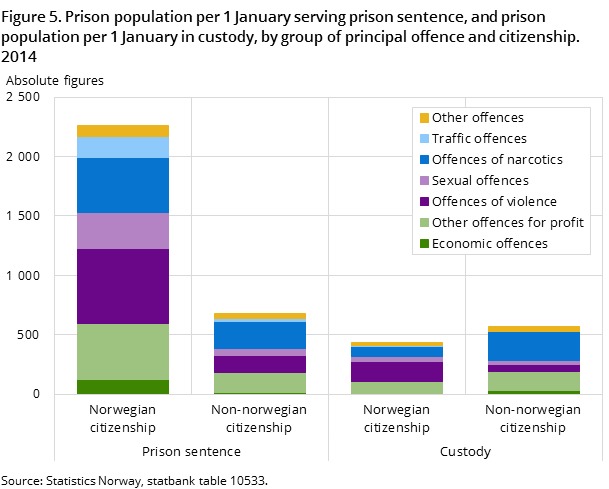
When breaking down imprisonments by type of imprisonment and groups of principal offence, we can see clear disparities between those with a Norwegian citizenship and those without. Of all Norwegian citizens imprisoned on 1 January, nearly 82 per cent were serving a prison sentence, and 16 per cent were held in custody. Of all those imprisoned who held a non-Norwegian citizenship, however, 54 per cent were serving a prison sentence and 45 per cent were being held in custody – as shown in figure 5.
Custody most common for non-Norwegian citizens
Non-Norwegian citizens made up over half (57 per cent) of those in custody and 23 per cent of those serving a prison sentence. Furthermore, 51 per cent of all new imprisonments in custody during 2014 related to non-Norwegian citizens.
Given that non-Norwegian citizens are being held in custody relatively more often than Norwegian citizens, there are disparities between these groups regarding their principal offence. For example, Non-Norwegian citizens made up 46 per cent of all those imprisoned for narcotic offences as the principal offence as of 1 January 2014. Among those held in custody for a narcotic principal offence, the share of non-Norwegian citizens was as much as 74 per cent.
Different types of offences give different types of imprisonment
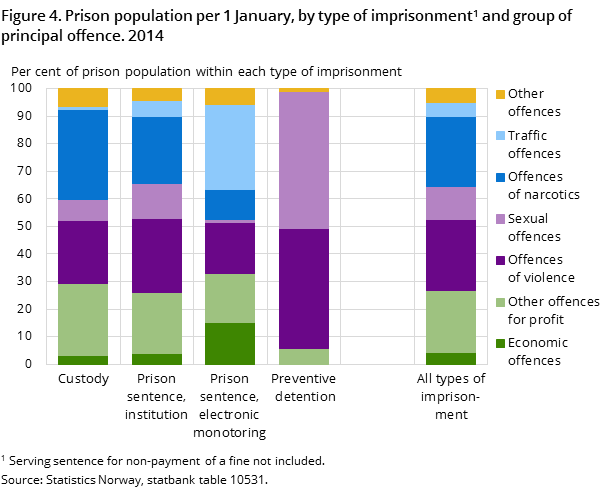
The use of different imprisonment types varies, depending on the type of principal offence on which the imprisonment is based. Of the 1 015 persons held in custody at the beginning of 2014, 32 per cent had a narcotic offence and 26 had theft or another offence for profit as their principal offence. Just over 22 per cent were being held in custody for an offence of violence, while fewer than 8 per cent were held in custody for a sexual offence. In comparison, 93 per cent of the 85 persons held in preventive detention had a violent or sexual offence as their principal offence, as illustrated in figure 4.
Some types of offences lead to shorter sentences
The offences of those imprisoned during a year somewhat differs from the offences of those who make up the prison population at any given time. This is partly due to shorter sentences and misdemeanours making up a bigger share of the new imprisonments. For example, traffic misdemeanours and narcotic offences each made up about 18 per cent of the new imprisonments, while only 5 per cent of the prison population at the beginning of the year had a traffic misdemeanour and as much as 25 per cent had a narcotic offence as their principal offence – as shown in figure 2.
More prison days in custody
Those held in custody during 2014 had a total of 384 000 days of imprisonment. This corresponds to 1 051 persons held in custody on an average day, which is 2 per cent more than the year before, and 11 per cent more than in 2012.
Increase in lengthy custody detentions
A drop of just over 12 per cent of new imprisonments in custody was registered in 2014. There was also a registered drop of nearly 8 per cent in completed custody detentions. The number of commenced and completed custody detentions saw significant drops in 2014, while the total number of prison days in custody saw an increase. This means that the average length of custody detentions increased from previous years.
Of the total 3 715 discharges from custody and transfers from custody to serving a sentence, 1 267 persons had been held in custody for 90 days or more. This is nearly a 10 per cent increase from the year before. At the same time there was a big drop in the number of custody detentions of less than 90 days. Those held in custody for less than 30 days saw the biggest drop – as much as 20 per cent from the year before.
Slight increase in completed prison days
Among those held in custody, the number of prison days increased for those serving a prison sentence. In 2014, nearly 11 000 more days were served in a prison facility than the year before. This is in addition to the increase in prison days as a result of the extended use of electronic monitoring (EM).
Number of sentences level with previous three years
The number of commenced and completed imprisonments is about level with the year before. This is the case for both shorter and lengthier imprisonments.
Of the total 8 228 discharges after imprisonment in 2014, 6 089 had a prison time of less than 90 days, of which 3 280 were less than 30 days. Thus, 74 per cent of all discharges after imprisonment had prison time of less than three months, and 40 per cent less than one month. These figures and shares have been constant during the period 2011-2014.
Increase in serving sentences by electronic monitoring
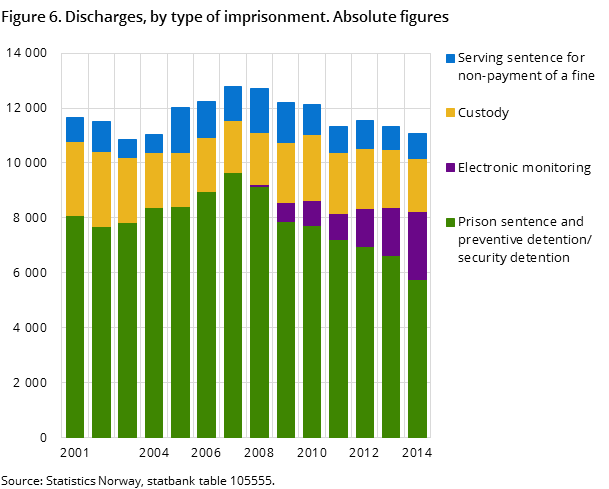
While the number of discharges from imprisonment has been relatively stable, there have been significant changes in the ways unconditional prison sentences are served – especially for the shortest sentences. The possibility of serving a sentence by electronic monitoring was introduced in 2008, and the use of electronic monitoring has increased in recent years, particularly after 2011. In total, 2 479 discharges from electronic monitoring were registered in 2014, which is 752 more than the year before and as much as 1 519 more than in 2011.
Many of the shortest sentences now served by electronic monitoring
Of all completed sentences with imprisonment in 2014, 30 per cent were partially or fully completed by electronic monitoring. As shown in figure 6, this is a significantly bigger share than previous years.
Of all the discharges with a prison time of less than one month, the share of electronic monitoring was as much as 44 per cent. Discharges from imprisonment for those who have served between 30-89 days totalled 30 per cent. The corresponding shares for these shorter sentences in 2011 were 18 and 10 per cent respectively, and less than 12 per cent of all completed imprisonments were carried out by electronic monitoring in 2011.
Electronic monitoring used for many types of offences
Among those discharged from electronic monitoring in 2014, 47 per cent had a traffic misdemeanour as their principal offence. Of those serving sentences for traffic offences, 80 per cent were convicted of driving under the influence. In total, there were 1 628 discharges from imprisonments for driving under the influence as the principal offence. Thus, a majority of these discharges (56 per cent) had completed their sentences with an ankle monitor outside of the prison facilities.
Serving at home with an ankle monitor is also a more frequently used alternative for prison sentences for several other types of offences. For example, of all completed electronic monitoring in 2014, 14 per cent had an offence of violence as their principal offence.
Contact
-
Kristin Bergvall
-
Susanne Fjelldalen
-
Reid Jone Stene
-
Statistics Norway's Information Centre

