Content
Published:
This is an archived release.
Norway and Iceland most expensive
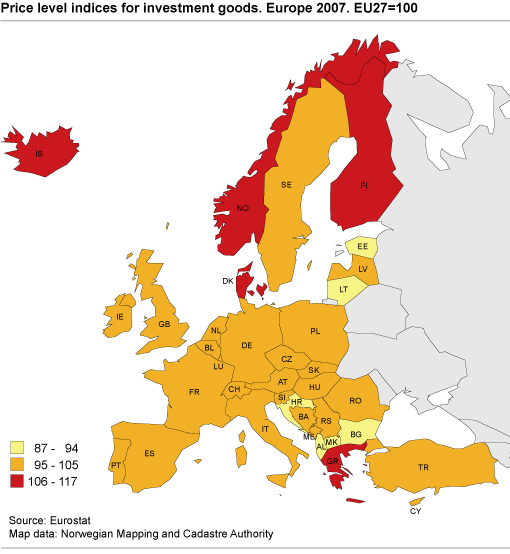
In 2007 Norway and Iceland had Europe’s highest price levels for investment goods, but only moderate above the European average. These are among the results from a price survey across 37 European countries.
In 2007 Norway and Iceland’s price levels were respectively 17 and 13 per cent above average based on the 27 EU countries (EU27). Generally the differences in price levels were very small between the countries. Of the 37 countries participating in the survey, 26 had a price level within +/- 5 per cent of the average. The homogenous price level for investment goods can be explained by a high level of integration of the markets for these products across Europe. Transport costs and any possible tax differences between countries therefore to a larger degree could explain the price level differences.
Expensive transport equipment in Norway
The Norwegian price level for "Metal products and equipment" was close to the average, only 5 per cent above EU27. The price levels for the subgroups "software" and “Electrical and optical equipment” were higher, respectively 17 and 19 per cent above EU27. Concerning “Transport equipment” Norway had Europe’s highest price level, 23 per cent above average of EU27.
Investment goods consists of the following components:1. Metal products and equipment (among other things; fabricated metal products, engines, other general purpose machinery, agricultural and forestry machinery, machine tools, machinery for construction, machinery for food, machinery for textile, other special purpose machinery. 2. Electrical and optical equipment (among other things; office machinery, computers, electrical machinery, radio, television, medical and precision instruments, other manufactured goods. 3. Transport equipment. 4. Software. The price level indices per country are expressed in relation to the average of the 27 EU countries (EU27). For instance, if the index is 108, the price level for the country concerned is 8 per cent above the EU average. The survey The survey was carried out within the framework of the European Comparison Programme 2007. The survey reflects the price level companies are facing when buying investment goods. The prices collected in the survey were without VAT, but include transport and delivery costs, and where relevant, assembly. The price material has later been adjusted to annual average prices and weighted based on information from each country's National Accounts. |
More details in Eurostat s "Statistics in Focus".
Tables:
The statistics is now published as Comparison of price levels in Europe.
Contact
-
Statistics Norway's Information Centre
E-mail: informasjon@ssb.no
tel.: (+47) 21 09 46 42

