Content
Published:
This is an archived release.
Homogeneous European price level
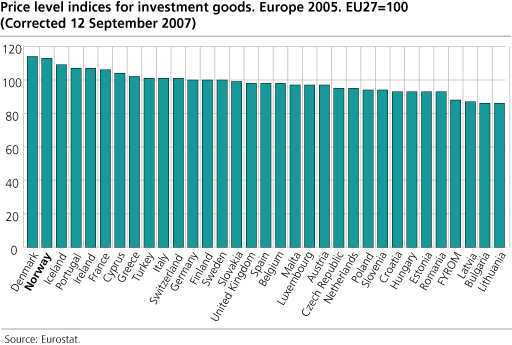
Denmark and Norway come out with the highest price levels for investment goods, moderate above the European average, according to results from a survey recently published by Eurostat. The survey reveals small differences in price levels between countries for such goods categories.
Price levels for investment goods in Norway and Denmark are respectively 13 and 14 per cent above average for the 27 EU countries (EU27). There are small distinctions between the countries. 27 out of totally 33 countries participating in the survey had a price level within +/- 10 per cent of the average. The survey reflects the price level companies are facing when buying investment goods.
The figure below illustrates that only the two relatively most expensive countries (Denmark and Norway) and the four relatively cheapest countries (Former Yugoslavian Republic of Macedonia, Bulgaria, Latvia and Lithuania) are clearly standing out.
World market prices
A possible reason for the homogenous price level for investment goods is perhaps that investment goods to a higher degree than consumer goods are imported. The prices reflect "world market prices", and thus are less influenced by the countries' general level of costs.
Norwegian price level for software below average
The table shows that the Norwegian price level for "software" are seven per cent below average of EU27. For the sub-groups "Metal products and equipment" and "Electrical and optical equipment", Norway comes out moderately above average of EU27.
The surveyThe survey was carried out within the framework of the European Comparison Programme 2005. The prices collected in the survey were without VAT, but include transport and delivery costs, and where relevant, assembly. The price material has later been adjusted to annual average prices and weighted based on information from each country's National Accounts. Investment goods’ components1. Metal products and equipment (among other things; metal products, engines, turbines, pumps and compressors. Agricultural and forestry machinery. Machine tools. Construction machinery. Machinery for food, beverages and tobacco processing. Machinery for textile, apparel and leather production). Hvorfor har du med flere her enn i den norske? 2. Electrical and optical equipment (among other things; office machinery, computers and other information processing equipment. Electrical machinery. Radio, television and communications equipment. Medical, precision and optical instruments). 3. Transport equipment. 4. Software. The two components "Investment goods" and "construction" together constitutes the aggregate "gross fixed capital formation". The price levels for "construction" are presented in an independent article. Read more in Eurostat s "Statistics in Focus". |
Tables:
The statistics is now published as Comparison of price levels in Europe.
Contact
-
Statistics Norway's Information Centre
E-mail: informasjon@ssb.no
tel.: (+47) 21 09 46 42

