Content
Published:
This is an archived release.
High price levels in the Nordic countries
The most recent calculation of the 2013 price levels in various European countries does not bring any big surprises. Switzerland and Norway stand out as having Europe’s highest price levels, while Denmark, Sweden and Finland are also among the most expensive countries.
| 2013 | |
|---|---|
| 1Source: Eurostat | |
| Norway | 155 |
| Iceland | 112 |
| Sweden | 130 |
| Denmark | 140 |
| Finland | 124 |
| France | 109 |
| Italy | 103 |
| Poland | 57 |
| United Kingdom | 114 |
| Germany | 102 |

According to figures from the EU statistical office (Eurostat), Norway’s price level for goods and services for household consumption was 55 per cent above the average of the 28 EU Member States in 2013. The corresponding figure for Switzerland was 56 per cent; in practice the same value as for Norway. Denmark was 40 per cent, Sweden 30 per cent and Finland 23 per cent above the EU average.
This means that Norway’s price level was 11 per cent higher than Denmark’s, 19 per cent higher than Sweden’s and 25 per cent higher than the price level in Finland.
High prices in the northwest, low prices in the southeast
The broader picture reveals that countries in Northwestern Europe, i.e. the Nordic countries, the UK, Ireland and the Benelux countries, have the highest price levels. Central and Southern Europe is generally somewhat cheaper, while the lowest price levels can be found in the east and southeast, notably in the Balkan countries.
This is in line with the frequent assumption that price levels and income levels as measured by gross domestic product (GDP) per capita are highly correlated: GDP per capita is generally much higher in the northwest than in the “new” EU Member States and in the Balkans. While this can be considered a rough rule of thumb, there are notable exceptions. Germany, for instance, has among the highest GDP per capita in the EU, while its price level is close to the European average.
Norway not always on top
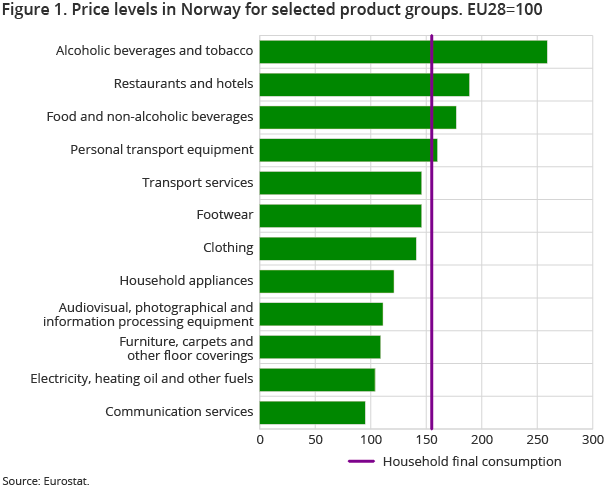
Although Norway’s price level for goods and services as a whole is the second highest in Europe, this is not the case for each and every product group. The chart shows the Norwegian price level for a selection of product groups relative to the EU average. It appears that the price level for communication services (mainly telecommunications) and for energy is quite close to the European average. In fact, 16 countries all over Europe have higher prices than Norway for communication services. These include Spain, Slovakia, the Netherlands, Greece, Belgium, Switzerland and Portugal. For energy, countries like Denmark, Sweden, Italy and Germany have significantly higher price levels than Norway.
However, some product groups do stand out as having an exceptionally high price level in Norway. This is particularly the case for alcoholic beverages and tobacco, which are subject to high excise duties. For this product group, Norway’s price level is more than double the EU average, and 46 per cent higher than Ireland, which comes second on the list. Restaurant and accommodation services, as well as food and non-alcoholic beverages, also have remarkably high price levels in Norway. Switzerland and our Nordic neighbours are also among the countries with relatively high price levels for these product groups. For personal transport equipment (mainly motor cars), Denmark and Norway stand out as having exceptionally high price levels.
It is important to bear in mind that price levels, whether high or low, do not provide an indication of the standard of living in the various countries per se. The amount of goods and services that can be purchased depends not only on the price level, but also on the level of income. As indicated above, there is frequently a high degree of correlation between price and income levels.
EU27 has become EU28 – Croatia’s EU membership impacts on previous years’ indicesOpen and readClose
Following the accession of Croatia to the EU in mid-2013, the price levels referred to in this article are expressed relative to the average price level of the 28 EU Member States (EU28=100). This means that the figures are not directly comparable with the indices in previous articles. However, in our statistics database (StatBank Norway) and in our tables, all figures dating back to 1995 have been recalculated to the EU28 base.
The statistics is now published as Comparison of price levels in Europe.
Contact
-
Statistics Norway's Information Centre
E-mail: informasjon@ssb.no
tel.: (+47) 21 09 46 42
