Content
Published:
This is an archived release.
Norway heads European price level comparison
Unsurprisingly, Europe’s highest price levels for consumer goods and services in 2012 were found in Norway and Switzerland. To some extent, the relative strength of the two countries’ currencies explains this. However, there are considerable price level differences between the various product groups.
| 2012 | |
|---|---|
| 1Source: Eurostat | |
| Norway | 159 |
| Denmark | 142 |
| Finland | 124 |
| France | 109 |
| Iceland | 116 |
| Italy | 105 |
| Poland | 58 |
| United Kingdom | 108 |
| Sweden | 128 |
| Germany | 102 |
Figures recently released by Eurostat indicate that Norway’s price level for consumer goods and services in 2012 was 59 per cent higher than the average of the 27 EU Member States. Norway’s price level was 12 per cent higher than Denmark’s and 24 per cent above Sweden’s price level.
Major price level dispersion in Europe
Only one European country, Switzerland, had a price level similar to Norway’s. Denmark, which had the highest price level in the EU, was 42 per cent above the EU average. The high price levels in Norway and Switzerland can be partly explained by the relative strength of the two countries’ currencies against the euro and other European currencies. A strong Norwegian krone “makes Norway more expensive” as seen from abroad.
There are substantial price level differences within Europe, and indeed within the EU. Most of the countries in eastern and central Europe that joined the EU in 2004 still have price levels far below the EU average. For example, Poland’s price level in 2012 was 42 per cent lower than in the EU as a whole. This means that prices in Norway were 2.7 times higher than in Poland.
It is important to keep in mind that there is usually a strong correlation between price levels and price level-adjusted incomes as measured by a country’s gross domestic product (GDP) per capita. Countries with high price levels thus often stand out with high levels of income as well. For this reason, price levels should not be interpreted as indicators of living standards unless combined with a measure of income.
Price levels not homogeneous across product groups
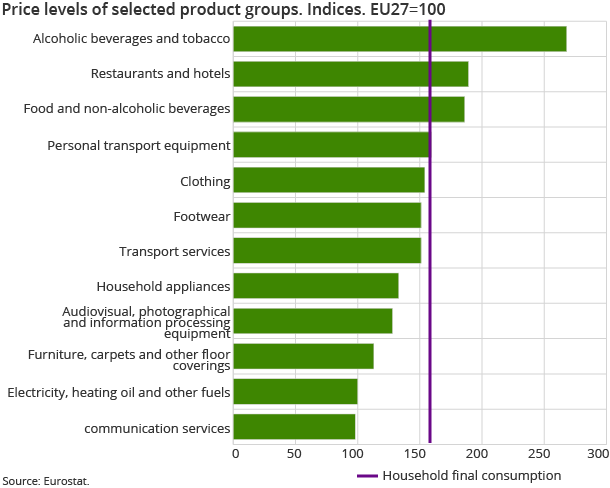
Although it is hardly surprising that Norway is the most expensive country in Europe, some product groups seem to be more or less in line with other countries. The chart shows the price level in Norway relative to the EU for a few selected groups of products. Notably, Norway’s price level for communication services, electricity and other fuels was at about the EU average, whereas furniture was somewhat more expensive in Norway. Consumer electronics and household appliances were about 30 per cent more expensive in Norway than in the EU, while the price levels for clothing and footwear, personal transport equipment and transport services were approximately 50 per cent above the EU average. Food and non-alcoholic beverages, hotels and restaurants, and in particular alcoholic beverages and tobacco were product groups with particularly high price levels.
The statistics is now published as Comparison of price levels in Europe.
Contact
-
Statistics Norway's Information Centre
E-mail: informasjon@ssb.no
tel.: (+47) 21 09 46 42

