Content
Published:
This is an archived release.
Higher electricity prices
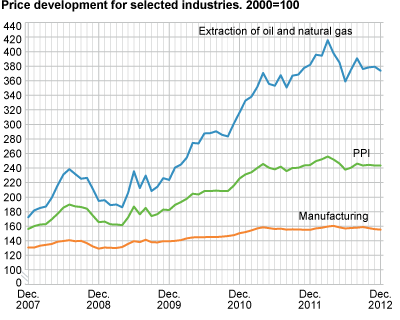
Higher electricity prices, which were offset by lower prices of crude oil and natural gas, and a decline in manufacturing were the reasons behind the producer price index (PPI) remaining unchanged from November to December.
Higher prices in the domestic market combined with a decline in exports resulted in an unchanged PPI from November to December. The price rise in the domestic market, which includes goods produced and sold in Norway, came mainly from higher electricity prices. Electricity prices increased by 17.0 per cent in December due to a rise in the spot price in Nord Pool, which was partly a result of cold and dry weather in the first two weeks of December.
The price decline in the export market was due to lower prices in the extraction of oil and natural gas. Prices of both oil and gas, measured in Norwegian krone (NOK), decreased from November to December. The entire price fall was a result of a strengthening of the NOK against the U.S. dollar. The oil price measured in USD increased by about 1.0 per cent in December, while prices of natural gas measured in USD were virtually unchanged from November to December.
Prices in manufacturing fell for the third consecutive month and had an overall price decline of 0.4 per cent in December. Prices decreased in both the domestic and export market, but the price decline in the export market was considerably stronger. The industries that contributed to the price decline in manufacturing were refined petroleum products, basic metals and fabricated metal products, which fell 2.2, 0.2 and 0.2 per cent respectively. The decline in chemical and pharmaceutical products in the export market has also contributed to the price decline in manufacturing.
PPI down 0.2 per cent from December 2011 to December 2012
The PPI fell 0.2 per cent from December 2011 to December 2012. Lower prices within extraction of oil and natural gas contributed the most. A strengthened NOK relative to USD in December 2012 was the reason behind the lower prices of crude oil and natural gas, measured in Norwegian krone. Within manufacturing, the 3.8 per cent fall in basic metal prices was the largest contributor to the decrease in the PPI in this twelve-month period.
Electricity and refined petroleum products were two industries that mitigated the decline in the PPI in this twelve-month period. Prices in these industries went up by 10.8 and 1.0 per cent respectively.
Annual growth: 2.8 per cent
The Producer price index rose by 2.8 per cent from 2011 to 2012, compared with a rise of 16.3 per cent from 2010 to 2011 (see annual change for more information ). All PPI industries had lower annual growth in 2012 compared with 2011. Higher prices in extraction of oil and natural gas, as well as refined petroleum products were drivers behind the positive annual change. Prices in electricity, basic metals, paper and paper products, as well as wood and wood products fell from 2011 to 2012 and curbed the annual growth in the PPI.
| December 2012 | Changes, per cent | ||||||||||||||||||||||||||||||||||||||||||||||||||||||||||||||||||||||||||||||
|---|---|---|---|---|---|---|---|---|---|---|---|---|---|---|---|---|---|---|---|---|---|---|---|---|---|---|---|---|---|---|---|---|---|---|---|---|---|---|---|---|---|---|---|---|---|---|---|---|---|---|---|---|---|---|---|---|---|---|---|---|---|---|---|---|---|---|---|---|---|---|---|---|---|---|---|---|---|---|---|
| November 2012- December 2012 | December 2011- December 2012 | ||||||||||||||||||||||||||||||||||||||||||||||||||||||||||||||||||||||||||||||
| Total index | 243.5 | - | -0.2 | ||||||||||||||||||||||||||||||||||||||||||||||||||||||||||||||||||||||||||||
| Extraction and related services | 374.0 | -1.4 | -2.1 | ||||||||||||||||||||||||||||||||||||||||||||||||||||||||||||||||||||||||||||
| Manufacturing, mining and quarrying | 155.5 | -0.4 | 0.3 | ||||||||||||||||||||||||||||||||||||||||||||||||||||||||||||||||||||||||||||
| Electricity, gas and steam supply | 272.4 | 17.5 | 10.8 | ||||||||||||||||||||||||||||||||||||||||||||||||||||||||||||||||||||||||||||
| Main industrial groupings | |||||||||||||||||||||||||||||||||||||||||||||||||||||||||||||||||||||||||||||||
| Intermediate goods | 141.1 | -0.1 | -0.6 | ||||||||||||||||||||||||||||||||||||||||||||||||||||||||||||||||||||||||||||
| Investment goods | 128.8 | - | 0.8 | ||||||||||||||||||||||||||||||||||||||||||||||||||||||||||||||||||||||||||||
| Consumer goods | 133.4 | -0.2 | -0.1 | ||||||||||||||||||||||||||||||||||||||||||||||||||||||||||||||||||||||||||||
| Energy goods | 353.9 | 0.1 | -0.3 | ||||||||||||||||||||||||||||||||||||||||||||||||||||||||||||||||||||||||||||
Tables
Additional information
Contact
-
Producer price index
E-mail: produsentpris@ssb.no
tel.: (+47) 21 09 40 00
-
Elisabeth Mælum
E-mail: elisabeth.maelum@ssb.no
tel.: (+47) 97 01 28 49
-
Morten Madshus
E-mail: morten.madshus@ssb.no
tel.: (+47) 40 90 26 94
-
Monika Græsli Engebretsen
E-mail: monika.graesli.engebretsen@ssb.no
tel.: (+47) 40 90 23 71
-
Håvard Georg Jensen
E-mail: havard.jensen@ssb.no
tel.: (+47) 40 90 26 86

