Content
Published:
This is an archived release.
Higher prices of basic metals and food
The producer price index rose by 1.2 per cent from January to February 2011. Two of the reasons for this were higher prices of metals and food.
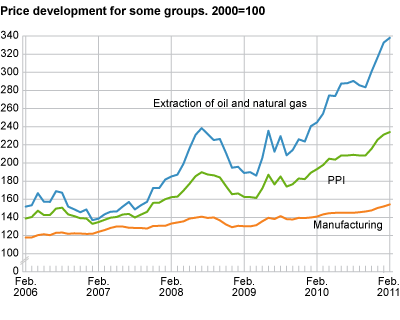
The producer price index rose by 1.2 per cent from January to February 2011. A rise in prices within extraction of oil and natural gas and refined petroleum products gave the strongest contribution to the total price growth. Other important reasons for the rise in the PPI this month were higher prices of basic metals and food. On the other hand, there was a price decrease of 5.6 per cent in electricity prices the same period.
Prices of basic metals rose by 3.2 per cent from January to February. Overall, export prices of basic metals had a stronger increase than the metal prices on the domestic market during this period. Non-ferrous metals were an exception, as prices for these metals rose by 4.4 per cent in the domestic market; a stronger price increase than in the export market.
Prices of food products rose by 1.6 per cent in the domestic market. Apart from the price increase within extraction of oil and natural gas, the price development of food products was the most important in explaining the overall price growth in the domestic market from January to February.
Twelve-month change: 21.2 per cent
PPI rose by 21.2 per cent from February 2010 to February 2011. Most industries experienced price growth during these twelve months, but there were also some exceptions.
The industries that gave the strongest contribution to the overall price growth were extraction of oil and natural gas, refined petroleum products, basic metals as well as food beverages and tobacco. Prices of computers, textiles and wearing apparels, as well as beverages, on the other hand, declined from February 2010 to February 2011.
| February 2011 | Changes, per cent | ||||||||||||||||||||||||||||||||||||||||||||||||||||||||||||||||||||||||||||||
|---|---|---|---|---|---|---|---|---|---|---|---|---|---|---|---|---|---|---|---|---|---|---|---|---|---|---|---|---|---|---|---|---|---|---|---|---|---|---|---|---|---|---|---|---|---|---|---|---|---|---|---|---|---|---|---|---|---|---|---|---|---|---|---|---|---|---|---|---|---|---|---|---|---|---|---|---|---|---|---|
| January 2011-February 2011 | February 2010-February 2011 | ||||||||||||||||||||||||||||||||||||||||||||||||||||||||||||||||||||||||||||||
| Total index | 234.1 | 1.2 | 21.2 | ||||||||||||||||||||||||||||||||||||||||||||||||||||||||||||||||||||||||||||
| Extraction of oil and natural gas | 338.0 | 1.6 | 38.1 | ||||||||||||||||||||||||||||||||||||||||||||||||||||||||||||||||||||||||||||
| Manufacturing, mining and quarrying | 154.3 | 1.4 | 9.6 | ||||||||||||||||||||||||||||||||||||||||||||||||||||||||||||||||||||||||||||
| Electricity, gas and steam supply | 388.9 | -5.6 | 0.0 | ||||||||||||||||||||||||||||||||||||||||||||||||||||||||||||||||||||||||||||
| Main industrial groupings | |||||||||||||||||||||||||||||||||||||||||||||||||||||||||||||||||||||||||||||||
| Intermediate goods | 146.9 | 1.6 | 9.9 | ||||||||||||||||||||||||||||||||||||||||||||||||||||||||||||||||||||||||||||
| Investment goods | 126.8 | 0.0 | 0.8 | ||||||||||||||||||||||||||||||||||||||||||||||||||||||||||||||||||||||||||||
| Consumer goods | 130.9 | 1.1 | 5.7 | ||||||||||||||||||||||||||||||||||||||||||||||||||||||||||||||||||||||||||||
| Energy goods | 327.0 | 1.3 | 33.0 | ||||||||||||||||||||||||||||||||||||||||||||||||||||||||||||||||||||||||||||
|
For information on the commodity price index for the industrial sectors, see commodity price index for the industrial sector . |
Additional information
Contact
-
Producer price index
E-mail: produsentpris@ssb.no
tel.: (+47) 21 09 40 00
-
Elisabeth Mælum
E-mail: elisabeth.maelum@ssb.no
tel.: (+47) 97 01 28 49
-
Morten Madshus
E-mail: morten.madshus@ssb.no
tel.: (+47) 40 90 26 94
-
Monika Græsli Engebretsen
E-mail: monika.graesli.engebretsen@ssb.no
tel.: (+47) 40 90 23 71
-
Håvard Georg Jensen
E-mail: havard.jensen@ssb.no
tel.: (+47) 40 90 26 86