Content
Published:
This is an archived release.
Higher oil and gas prices
The producer price index (PPI) increased by 2.5 per cent from December 2010 to January 2011. Price rise in oil and natural gas have contributed the most to the increase in PPI.
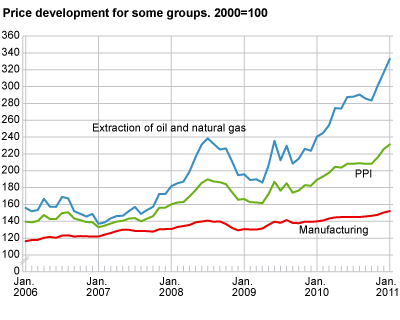
Extraction of oil and natural gas as well as refined petroleum products played the largest role in bringing PPI up in January. Prices in these groups rose by 5.1 and 3.0 per cent respectively. Prices of crude oil have been rising sharply since July 2010 and experienced further increase by nearly 4.0 per cent last month. Strong growth and high demand for oil globally were the main reasons why oil prices went up. Also higher export prices of natural gas contributed to the rise in the index for extraction of oil and natural gas. Among the possible explanations for the higher gas prices can be the cold and early winter in Europe.
Electricity prices decreased by 4.6 per cent in January, largely due to the lower spot prices at Nord Pool.
Price rises of 1.1 per cent in manufacturing
Chemical and pharmaceutical products, basic metals, food products, and textiles and wearing apparel can also be included to the list of industries with the greatest price rise and greatest contribution to the index in January.
Prices in chemical and pharmaceutical products rose by 2.2 per cent, mainly due to increase in prices of pharmaceutical raw materials. Prices in basic metals experienced further rise, by 2.4 per cent in January. Higher prices of iron and steel, as well as non-ferrous metals were the reasons for this price increase. Also prices in textiles and wearing apparel rose slightly last month. Possible explanation for this could be a sharp rise in international cotton prices the last six month.
Prices in food products went up by 0.1 per cent in the domestic market in January, mainly due to expensive animal feed, milk and milk products and cereals and cereal products. Other groups within this industry fell slightly from December to January.
Twelve-month growth: prices up 22.2 per cent
PPI increased by 22.2 per cent from January 2010 to January 2011. All industries experienced inflation in this period. As in previous month the higher energy prices were the most important contribution to the twelve-month growth. Prices in extraction of oil and natural gas increased by 38.3 per cent, while electricity prices were 29.0 per cent higher in January 2011 than in January 2010.
Within manufacturing, refined petroleum products, basic metals, food industry, chemical and pharmaceutical products contributed the most.
Updated weights in the indexWith the new year, the weights used to compute the price indices have been updated. The weights indicate the relative influence of different industries on the overall index, and are based on the industries' share of Norwegian output value in the previous year. Compared with 2010, manufacturing has more to say in the index in 2011, at the expense of oil and gas. The value of output has increased in both manufacturing and extraction of oil and natural gas, but production increased relatively more in manufacturing. Therefore the relative weight of manufacturing is higher in 2011 than last year. Within manufacturing, the weights of basic metals, basic chemicals and refined petroleum products increased the most. All changes in the weights are due to a combination of changes in production volumes and prices. Use the links "Weights" or "More tables in StatBank" in the left hand window for more details about the weights. |
| January 2011 | Changes, per cent | ||||||||||||||||||||||||||||||||||||||||||||||||||||||||||||||||||||||||||||||
|---|---|---|---|---|---|---|---|---|---|---|---|---|---|---|---|---|---|---|---|---|---|---|---|---|---|---|---|---|---|---|---|---|---|---|---|---|---|---|---|---|---|---|---|---|---|---|---|---|---|---|---|---|---|---|---|---|---|---|---|---|---|---|---|---|---|---|---|---|---|---|---|---|---|---|---|---|---|---|---|
| December 2010-January 2011 | January 2010-January 2011 | ||||||||||||||||||||||||||||||||||||||||||||||||||||||||||||||||||||||||||||||
| Total index | 231.3 | 2.5 | 22.2 | ||||||||||||||||||||||||||||||||||||||||||||||||||||||||||||||||||||||||||||
| Extraction of oil and natural gas | 332.8 | 5.1 | 38.3 | ||||||||||||||||||||||||||||||||||||||||||||||||||||||||||||||||||||||||||||
| Manufacturing, mining and quarrying | 152.1 | 1.1 | 8.8 | ||||||||||||||||||||||||||||||||||||||||||||||||||||||||||||||||||||||||||||
| Electricity, gas and steam supply | 412.0 | -4.6 | 29.0 | ||||||||||||||||||||||||||||||||||||||||||||||||||||||||||||||||||||||||||||
| Main industrial groupings | |||||||||||||||||||||||||||||||||||||||||||||||||||||||||||||||||||||||||||||||
| Intermediate goods | 144.6 | 1.1 | 9.3 | ||||||||||||||||||||||||||||||||||||||||||||||||||||||||||||||||||||||||||||
| Investment goods | 126.8 | 0.2 | 1.5 | ||||||||||||||||||||||||||||||||||||||||||||||||||||||||||||||||||||||||||||
| Consumer goods | 129.5 | 0.5 | 4.9 | ||||||||||||||||||||||||||||||||||||||||||||||||||||||||||||||||||||||||||||
| Energy goods | 322.9 | 4.0 | 35.4 | ||||||||||||||||||||||||||||||||||||||||||||||||||||||||||||||||||||||||||||
For information on the commodity price index for the industrial sectors, see commodity price index for the industrial sector .
Additional information
Contact
-
Producer price index
E-mail: produsentpris@ssb.no
tel.: (+47) 21 09 40 00
-
Elisabeth Mælum
E-mail: elisabeth.maelum@ssb.no
tel.: (+47) 97 01 28 49
-
Morten Madshus
E-mail: morten.madshus@ssb.no
tel.: (+47) 40 90 26 94
-
Monika Græsli Engebretsen
E-mail: monika.graesli.engebretsen@ssb.no
tel.: (+47) 40 90 23 71
-
Håvard Georg Jensen
E-mail: havard.jensen@ssb.no
tel.: (+47) 40 90 26 86