Content
Published:
This is an archived release.
Further price increase on oil and electricity
The producer price index rose by 3.6 per cent from October to November. The increase came largely from higher prices on energy products.
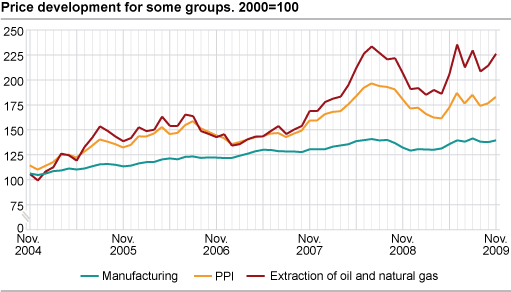
Price increases in extraction of oil and natural gas together with increased electricity prices, were the main explanations for the overall price rise by 3.6 percent in November. Prices on extraction of oil and natural gas went up by 5.5 per cent due to decreasing inventories and lower demand on crude oil in much of November. The electricity prices rose by 8.3 per cent this month. The producer price index is virtually unchanged from the previous month, price rise for energy products aside.
Rise in export market prices
Prices within manufacturing, mining and quarrying rose by 1.3 per cent, and the rise was greatest in the export market. The largest contribution to the increased prices in manufacturing in November came from the industries for refined petroleum products and basic metals. Here, the prices went up by 5.0 and 1.2 per cent respectively. In the latter group, the non-ferrous metals, including aluminium and sink, accounted for much of the price rise, with an increase of 1.5 per cent in November.
There are two industries that contributed to curbing the rise in manufacturing prices in November, chemical and pharmaceutical products, as well as paper and paper products. Prices on chemical and pharmaceutical products declined by 1.2 per cent, and this decrease were particularly large in the domestic market. Prices for paper and paper products fell three months in a row and decreased by 3.8 per cent in November.
Twelve months rate: growth in the producer prices
Producer prices went up by 4.8 per cent from November 2008 to November 2009. It was the first time since June that the change in twelve month rate was positive. The increase was mainly due to higher prices within extraction of oil and natural gas in November this year compared to the corresponding period last year, when oil prices plunged towards the end of 2008. Refined petroleum products had some of the same price development as oil. Here, the prices were 18.6 per cent higher than twelve months ago, and the change was particularly high on export market. The prices on non-ferrous metals were 6.3 per cent higher, while prices on iron and steel were significantly reduced over the last twelve months.
Electricity prices were 32 per cent lower this year compared to last year, despite the rise in electricity prices in the last two months. Prices in chemical raw materials fell by 10.3 per cent in November compared to the same month last year. In November 2008, prices for Norwegian-produced fertilizer were record high due to high international demand.
| November 2009 | Changes, per cent | ||||||||||||||||||||||||||||||||||||||
|---|---|---|---|---|---|---|---|---|---|---|---|---|---|---|---|---|---|---|---|---|---|---|---|---|---|---|---|---|---|---|---|---|---|---|---|---|---|---|---|
| October 2009-November 2009 | November 2008-November 2009 | ||||||||||||||||||||||||||||||||||||||
| Total index | 182.9 | 3.6 | 4.8 | ||||||||||||||||||||||||||||||||||||
| Extraction of oil and natural gas | 226.1 | 5.5 | 7.1 | ||||||||||||||||||||||||||||||||||||
| Manufacturing, mining and quarrying | 139.6 | 1.3 | 5.4 | ||||||||||||||||||||||||||||||||||||
| Electricity, gas and steam supply | 257.6 | 8.3 | -32.2 | ||||||||||||||||||||||||||||||||||||
| Main industrial groupings | |||||||||||||||||||||||||||||||||||||||
| Intermediate goods | 131.9 | -0.1 | -2.0 | ||||||||||||||||||||||||||||||||||||
| Investment goods | 124.8 | 0.2 | 3.1 | ||||||||||||||||||||||||||||||||||||
| Consumer goods | 122.7 | 0.0 | 1.3 | ||||||||||||||||||||||||||||||||||||
| Energy goods | 224.0 | 5.5 | 7.0 | ||||||||||||||||||||||||||||||||||||
For information on the commodity price index for the industrial sectors, see http://www.ssb.no/vppi
Additional information
Contact
-
Producer price index
E-mail: produsentpris@ssb.no
tel.: (+47) 21 09 40 00
-
Elisabeth Mælum
E-mail: elisabeth.maelum@ssb.no
tel.: (+47) 97 01 28 49
-
Morten Madshus
E-mail: morten.madshus@ssb.no
tel.: (+47) 40 90 26 94
-
Monika Græsli Engebretsen
E-mail: monika.graesli.engebretsen@ssb.no
tel.: (+47) 40 90 23 71
-
Håvard Georg Jensen
E-mail: havard.jensen@ssb.no
tel.: (+47) 40 90 26 86