Content
Published:
This is an archived release.
Increase in oil and manufacturing prices
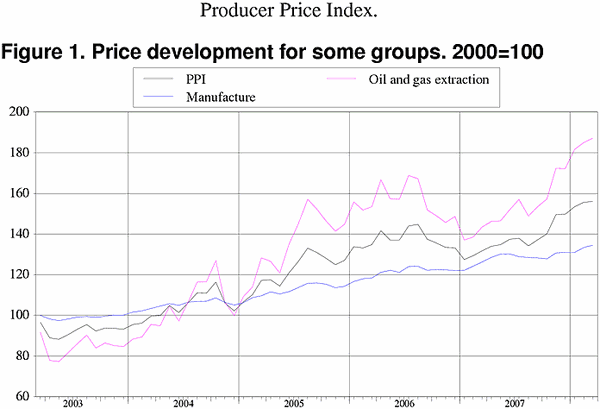
The oil price reached record levels in March. This, along with higher manufacturing prices, contributed to a 0.4 per cent increase in the producer price index.
With a 0.4 per cent rise, March was the seventh consecutive month with an increase in the producer price index (PPI). The average price of oil (Brent Blend, in NOK) was 4.2 per cent higher than in February, climbing to yet another high.
Prices also increased in the manufacturing sector. The price index for manufacturing rose by 0.9 per cent. The industries with the highest growth rates were those producing basic metals, pulp and paper products, petroleum products and rubber and plastic products.
The prices of basic metals increased by 2.8 per cent. The growth was mainly due to higher prices of non-ferrous metals, which in the Norwegian case is dominated by aluminum. Following nine months of relatively strong decrease, the prices of non-ferrous metals have bounced back with growth of more than 3 per cent in each of the past two months. Prices of pulp and paper products, refined petroleum products and rubber and plastic products were up 1.9, 1.4 and 1.3 per cent, respectively.
Other industries saw relatively moderate price changes. Prices of textiles, wearing apparel and leather fell by 0.8 per cent, while prices of wood and wood products rose by 0.6 per cent. The other manufacturing industries saw price changes of less than 0.5 per cent.
The one exception to the modest price changes mentioned above was the price of electricity. This price index fell by 22.8 per cent from February to March.
Twelve-month change: 18.5 per cent
The total producer price index was 18.5 per cent higher in March 2008 than in March 2007. The main reason for the strong increase was found in the market for energy goods, with considerably higher prices of oil, electricity and petroleum products. The oil price (Brent Blend) has increased by 40.5 per cent over the past twelve months, and despite this month's fall, the price of electricity was still 22.5 per cent higher than in March last year. Prices of refined petroleum products were 28.0 per cent higher than one year earlier.
Prices of food products were 3.6 per cent higher in March 2008 than in March 2007, while prices of electrical and optical equipment fell by 3.2 per cent in the same period.
| March 2008 | Changes, per cent | ||||||||||||||||||||||||||||||||||||||
|---|---|---|---|---|---|---|---|---|---|---|---|---|---|---|---|---|---|---|---|---|---|---|---|---|---|---|---|---|---|---|---|---|---|---|---|---|---|---|---|
|
February 2008-
March 2008 |
March 2007-
March 2008 |
||||||||||||||||||||||||||||||||||||||
| Total index | 156.1 | 0.4 | 18.5 | ||||||||||||||||||||||||||||||||||||
| Oil and gas extraction | 187.1 | 1.1 | 30.5 | ||||||||||||||||||||||||||||||||||||
| Manufacturing, mining and quarrying | 134.6 | 0.9 | 6.7 | ||||||||||||||||||||||||||||||||||||
| Electricity, gas and steam supply | 206.8 | -22.8 | 22.5 | ||||||||||||||||||||||||||||||||||||
| Main industrial groupings | |||||||||||||||||||||||||||||||||||||||
| Intermediate goods | 129.1 | 1.4 | 1.1 | ||||||||||||||||||||||||||||||||||||
| Capitals goods | 117.1 | -0.1 | 2.0 | ||||||||||||||||||||||||||||||||||||
| Consumer goods | 116.0 | 0.1 | 2.7 | ||||||||||||||||||||||||||||||||||||
| Energy goods | 189.0 | 0.1 | 30.6 | ||||||||||||||||||||||||||||||||||||
For information on the commodity price index for the industrial sectors, see http://www.ssb.no/vppi
Additional information
Contact
-
Producer price index
E-mail: produsentpris@ssb.no
tel.: (+47) 21 09 40 00
-
Elisabeth Mælum
E-mail: elisabeth.maelum@ssb.no
tel.: (+47) 97 01 28 49
-
Morten Madshus
E-mail: morten.madshus@ssb.no
tel.: (+47) 40 90 26 94
-
Monika Græsli Engebretsen
E-mail: monika.graesli.engebretsen@ssb.no
tel.: (+47) 40 90 23 71
-
Håvard Georg Jensen
E-mail: havard.jensen@ssb.no
tel.: (+47) 40 90 26 86

