Content
Published:
This is an archived release.
Strong growth in producer prices
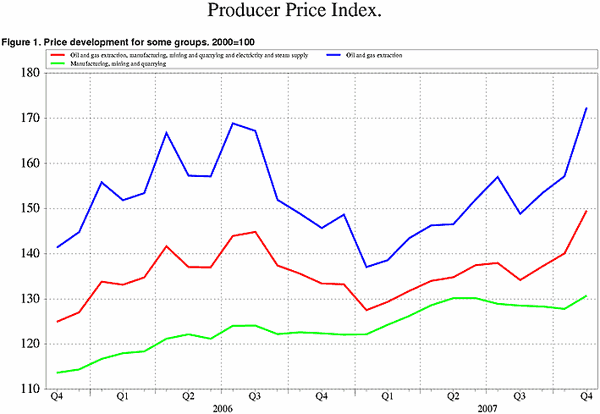
Oil and electricity prices contributed to push the total PPI up by a strong 6.8 per cent from October to November. Following four months of decline, manufacturing prices rose by 2.3 per cent in November.
A 12.4 per cent increase in the average oil price (Brent Blend, in NOK) from November to October was the main reason behind the 6.8 per cent growth in the total producer price index (PPI). This is the highest monthly rate of change in the overall index since September 2000. The index for oil and gas extraction was 9.7 per cent higher in November than in October.
The oil price development seems to have fuelled an increase in prices of refined petroleum products. This sub-index rose by 10.8 per cent from October to November, which is a relatively strong increase. The monthly growth has not been above 10 per cent since July 2005, and contributed heavily to the 2.3 per cent increase in the index for manufacturing goods.
The index for electricity rose by 28.7 per cent and has increased by a staggering 272.8 per cent since electricity prices hit record low levels in August.
In manufacturing, most other sub-indices saw moderate changes from October to November. The index for chemicals and chemical products fell by 0.7 per cent due to lower prices of several basic chemicals and pesticides. Prices of basic metals such as copper, zinc and lead decreased, resulting in a 1.3 per cent decline in the index for non-ferrous metals. Iron and steel prices increased, however, and the overall basic metals index edged down by 0.1 per cent.
Twelve-month change
The total producer price index was 12.1 per cent higher in November compared with the same month last year. The twelve-month growth rate for the oil and gas extraction index was 18.3 per cent. With the past few months’ rapid growth in electricity prices these were almost at the same level as in November 2006. The electricity index in November was 5.1 per cent higher than twelve months ago.
Following a period of high price growth last year and this spring, prices of basic metals have cooled off slightly. The index for basic metals and its sub-index for non-ferrous metals fell by 3.5 and 11.8 per cent respectively from November 2006 to November 2007. Overall, manufacturing goods prices rose by 6.8 per cent in the same period.
| November 2007 | Changes, per cent | ||||||||||||||||||||||||||||||||||||||
|---|---|---|---|---|---|---|---|---|---|---|---|---|---|---|---|---|---|---|---|---|---|---|---|---|---|---|---|---|---|---|---|---|---|---|---|---|---|---|---|
|
October 2007-
November 2007 |
November 2006-
November 2007 |
||||||||||||||||||||||||||||||||||||||
| Total index | 149.6 | 6.8 | 12.1 | ||||||||||||||||||||||||||||||||||||
| Oil and gas extraction | 172.4 | 9.7 | 18.3 | ||||||||||||||||||||||||||||||||||||
| Manufacturing, mining and quarrying | 130.7 | 2.3 | 6.8 | ||||||||||||||||||||||||||||||||||||
| Electricity, gas and steam supply | 314.8 | 28.7 | 5.1 | ||||||||||||||||||||||||||||||||||||
| November 2007 | Changes, per cent | ||||||||||||||||||||||||||||||||||||||
|---|---|---|---|---|---|---|---|---|---|---|---|---|---|---|---|---|---|---|---|---|---|---|---|---|---|---|---|---|---|---|---|---|---|---|---|---|---|---|---|
|
October 2007-
November 2007 |
November 2006-
November 2007 |
||||||||||||||||||||||||||||||||||||||
| Total index | 156.2 | 6.8 | 12.1 | ||||||||||||||||||||||||||||||||||||
| Oil and gas extraction | 172.4 | 9.7 | 18.3 | ||||||||||||||||||||||||||||||||||||
| Manufacturing, mining and quarrying | 130.9 | 2.3 | 6.8 | ||||||||||||||||||||||||||||||||||||
| Electricity, gas and steam supply | 304.6 | 28.7 | 5.1 | ||||||||||||||||||||||||||||||||||||
Additional information
Contact
-
Producer price index
E-mail: produsentpris@ssb.no
tel.: (+47) 21 09 40 00
-
Elisabeth Mælum
E-mail: elisabeth.maelum@ssb.no
tel.: (+47) 97 01 28 49
-
Morten Madshus
E-mail: morten.madshus@ssb.no
tel.: (+47) 40 90 26 94
-
Monika Græsli Engebretsen
E-mail: monika.graesli.engebretsen@ssb.no
tel.: (+47) 40 90 23 71
-
Håvard Georg Jensen
E-mail: havard.jensen@ssb.no
tel.: (+47) 40 90 26 86

