Content
Published:
This is an archived release.
Fall in manufacturing prices continues
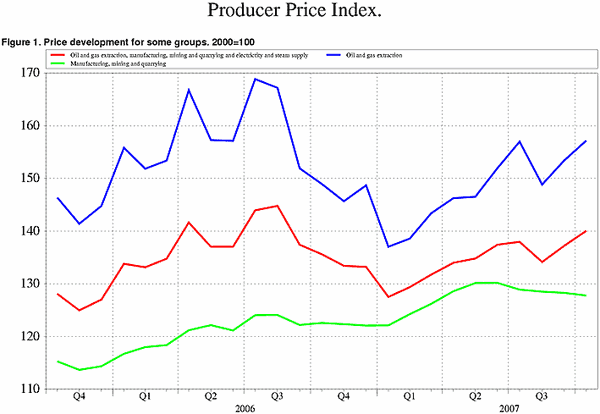
October saw manufacturing prices fall for the fourth consecutive month. With a rise in oil and electricity prices, however, the overall producer price index increased by 2.3 per cent.
The overall producer price index rose by 2.1 per cent from September to October, mainly due to higher prices of energy. The monthly average spot price of electricity at Nord Pool, the Nordic power exchange, rose by 42.4 per cent. The oil price increased by 1.7 per cent (Brent Blend, in NOK), leading to a 2.5 per cent growth in the index for oil and gas extraction.
Manufacturing prices down
The sub-index for manufacturing goods fell by 0.4 per cent from September to October. This is the fourth consecutive month of decrease and the sub-index with the largest decrease was pulp and paper products, down 3.5 per cent. The index for basic metals declined by 1.0 per cent. Since the last peak in April, the metals index has fallen by 9.5 per cent. Several other sub-indices in the manufacturing sector decreased moderately from September to October.
Looking at industrial groupings, the discrepancy between price developments in the energy and manufacturing sectors is evident. The index for energy goods shows a 3.7 rise, while all other groups (intermediate goods, capital goods and durable and non-durable consumption goods) had negative index changes.
Twelve-month change
The total producer price index was 3.3 per cent lower in October compared with the same month last year. Despite this month's increase, the index for electricity is still 27.1 per cent lower than twelve months ago. The average spot price of electricity has dropped 37.5 per cent since October last year. The oil price is 17.7 per cent higher than one year ago, and the index for oil and gas extraction has increased by 5.5 per cent.
By industrial grouping, most of the twelve month changes show developments opposite to those of the monthly rates: Energy goods are up 4.2 per cent over the year, while the indices for intermediate, capital and consumption goods have increased 1.6, 2.1 and 1.4 per cent, respectively.
| October 2007 | Changes, per cent | ||||||||||||||||||||||||||||||||||||||
|---|---|---|---|---|---|---|---|---|---|---|---|---|---|---|---|---|---|---|---|---|---|---|---|---|---|---|---|---|---|---|---|---|---|---|---|---|---|---|---|
|
September 2007-
October 2007 |
October 2006-
October 2007 |
||||||||||||||||||||||||||||||||||||||
| Total index | 140.1 | 2.1 | 3.3 | ||||||||||||||||||||||||||||||||||||
| Oil and gas extraction | 157.2 | 2.5 | 5.5 | ||||||||||||||||||||||||||||||||||||
| Manufacturing, mining and quarrying | 127.8 | -0.4 | 4.2 | ||||||||||||||||||||||||||||||||||||
| Electricity, gas and steam supply | 244.7 | 42.1 | -27.1 | ||||||||||||||||||||||||||||||||||||
| October 2007 | Changes, per cent | ||||||||||||||||||||||||||||||||||||||
|---|---|---|---|---|---|---|---|---|---|---|---|---|---|---|---|---|---|---|---|---|---|---|---|---|---|---|---|---|---|---|---|---|---|---|---|---|---|---|---|
|
September 2007-
October 2007 |
October 2006-
October 2007 |
||||||||||||||||||||||||||||||||||||||
| Total index | 146.3 | 2.1 | 3.3 | ||||||||||||||||||||||||||||||||||||
| Oil and gas extraction | 157.2 | 2.5 | 5.5 | ||||||||||||||||||||||||||||||||||||
| Manufacturing, mining and quarrying | 128.0 | -0.4 | 4.2 | ||||||||||||||||||||||||||||||||||||
| Electricity, gas and steam supply | 236.7 | 42.1 | -27.1 | ||||||||||||||||||||||||||||||||||||
Additional information
Contact
-
Producer price index
E-mail: produsentpris@ssb.no
tel.: (+47) 21 09 40 00
-
Elisabeth Mælum
E-mail: elisabeth.maelum@ssb.no
tel.: (+47) 97 01 28 49
-
Morten Madshus
E-mail: morten.madshus@ssb.no
tel.: (+47) 40 90 26 94
-
Monika Græsli Engebretsen
E-mail: monika.graesli.engebretsen@ssb.no
tel.: (+47) 40 90 23 71
-
Håvard Georg Jensen
E-mail: havard.jensen@ssb.no
tel.: (+47) 40 90 26 86

