Content
Published:
This is an archived release.
Five months of falling producer prices
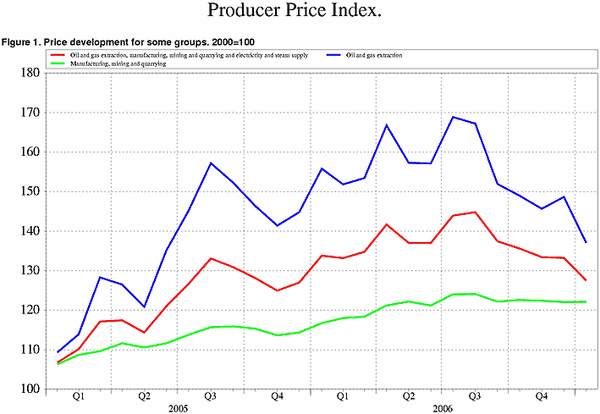
The producer price index (PPI) decreased 4.3 per cent from December to January. This contributes to the longest period of negative growth in the total index since 2000, with five consecutive months of decrease. The development is closely related to the fall in energy prices since the peak in late summer of last year.
With a relatively steep decrease of 4.3 per cent from December to January, the producer price index (PPI) has fallen continuously since August. The longest period of uninterrupted decrease since the index was launched in January 2000 has brought the index down 12 per cent since the August peak. The development is mostly related to prices of energy goods. Prices of both oil and electricity peaked in the late summer of last year. Oil prices increased over the summer due to uncertainty in the Middle East, and has subsequently fallen by 18 per cent since August. A dry summer and production halts in Swedish nuclear power plants caused the price of electricity to peak around the same time, and it has fallen by a massive 47.8 per cent since. A mild winter has affected the prices of both energy sources. From December to January the oil and electricity indices fell 7.2 and 16.3 per cent, respectively.
The index for food and beverages fell slightly by 0.2 per cent mainly due to high supply, and thus low prices, of meats.
Other industry level indices have seen increases, however. The index for wood and wood products jumped 4.3 per cent from December to January. High demand from construction in China and continental Europe has led to high prices in both domestic and export markets for Norwegian producers.
The index for metal prices has increased steeply over the past twelve months and rose by another 3.8 per cent from December to January. Iron and steel prices fell slightly, but increases in prices of aluminium and nickel, the more important metals in Norwegian production, led to an overall increase in the index.
Price changes in the domestic market were similar to those in the index for the domestic and export markets total. The fall in the food and beverages index was somewhat larger domestically, with 0.5 per cent. With oil prices influencing the domestic index less than the total, the PPI for goods produced and sold in Norway fell by 3.1 per cent.
January 2006 to January 2007: Total fall of 4.7 per cent
With oil and electricity prices being 12.1 and 25.2 per cent lower than January 2006, the PPI has fallen 4.7 per cent over the past twelve months. Apart from energy goods, all groups of industrial goods have seen prices increase. The metals index is up a noticeable 32 per cent from last January, contributing strongly to the 13.7 per cent increase in the index for intermediate goods.
Change in index weights
The price index is calculated as a weighted average of observed price changes. The weights used are intended to reflect different industries' share of total production and import of manufactured products and intermediate and energy goods. To accommodate for the changing balance between different industries, the weights are updated each year and introduced in January. Energy goods, already the main influence, have increased their share of the weights in 2007 compared with 2006. The weights of intermediate goods have also increased. This comes at the expense particularly of durable consumption goods' weights, although these were already at a low level. Non-durable consumer goods and investment goods have reduced their share of the weights from 9.2 and 5.7 to 8.8 and 5.1 per cent of the total, respectively.
| Producer price index. 2000=100 |
| January 2007 | Changes, per cent | ||||||||||||||||||||||||||||||||||||||
|---|---|---|---|---|---|---|---|---|---|---|---|---|---|---|---|---|---|---|---|---|---|---|---|---|---|---|---|---|---|---|---|---|---|---|---|---|---|---|---|
|
December 2006-
January 2007 |
January 2006-
January 2007 |
||||||||||||||||||||||||||||||||||||||
| Total index | 1127.5 | 1-4.3 | 1-4.7 | ||||||||||||||||||||||||||||||||||||
| Oil and gas extraction | 137.0 | -7.8 | -12.1 | ||||||||||||||||||||||||||||||||||||
| Manufacturing, mining and quarrying | 1122.1 | 10.1 | 14.7 | ||||||||||||||||||||||||||||||||||||
| Electricity, gas and steam supply | 198.6 | -16.3 | -25.2 | ||||||||||||||||||||||||||||||||||||
| 1 | The figure is corrected 2 February 2007 at 11:45 a.m. |
| Commodity price index for the industrial sectors. 2000=100 |
| January 2007 | Changes, per cent | ||||||||||||||||||||||||||||||||||||||
|---|---|---|---|---|---|---|---|---|---|---|---|---|---|---|---|---|---|---|---|---|---|---|---|---|---|---|---|---|---|---|---|---|---|---|---|---|---|---|---|
|
December 2006-
January 2007 |
January 2006-
January 2007 |
||||||||||||||||||||||||||||||||||||||
| Total index | 1133.2 | 1-4.3 | 1-4.7 | ||||||||||||||||||||||||||||||||||||
| Oil and gas extraction | 137.0 | -7.8 | -12.1 | ||||||||||||||||||||||||||||||||||||
| Manufacturing, mining and quarrying | 1122.3 | 10.1 | 4.8 | ||||||||||||||||||||||||||||||||||||
| Electricity, gas and steam supply | 192.2 | -16.3 | -25.2 | ||||||||||||||||||||||||||||||||||||
| 1 | The figure is corrected 2 February 2007 at 11:45 a.m. |
Additional information
Contact
-
Producer price index
E-mail: produsentpris@ssb.no
tel.: (+47) 21 09 40 00
-
Elisabeth Mælum
E-mail: elisabeth.maelum@ssb.no
tel.: (+47) 97 01 28 49
-
Morten Madshus
E-mail: morten.madshus@ssb.no
tel.: (+47) 40 90 26 94
-
Monika Græsli Engebretsen
E-mail: monika.graesli.engebretsen@ssb.no
tel.: (+47) 40 90 23 71
-
Håvard Georg Jensen
E-mail: havard.jensen@ssb.no
tel.: (+47) 40 90 26 86

