Content
Published:
This is an archived release.
Slump in prices of electricity
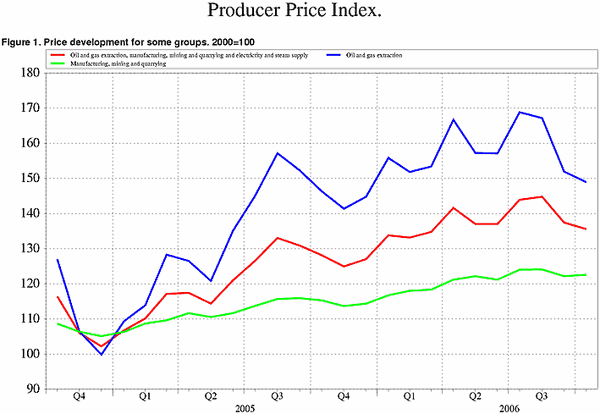
Producers of electricity have experienced a dramatic fall in the prices since early this autumn. The prices of electricity fell by 11 per cent in October. With a slight fall in prices of crude oil and natural gas by 2 per cent, the Producer Price Index (PPI) went down 1.3 per cent.
While most analysts predicted higher prices, the opposite has occurred. After a period with high energy prices, both prices of electric power and crude oil fell last month. The prices of electricity have fallen as Norway has experienced more rain and higher temperatures than normal for this time of the year. At the same time power production from nuclear power plants in Sweden was up again after a temporary closure this summer. This led to significant import of electricity from Sweden. Nevertheless, there is great uncertainty regarding the prices of electric power in the coming months. Water reservoir levels in October was about 64 per cent of total reservoir capacity, while it was about 90 per cent last year, according to The Norwegian Water Resources and Energy Directorate (NVE). The prices of electricity in October were 60.4 per cent higher than October 2005.
Lower crude oil prices
The price of crude oil (Brent blend) was just below 60 USD per gallon for the whole of October. This was 4.2 per cent lower than for September. On the 20t h of September, OPEC decided to reduce production with 1.2 billion barrels a day from 1s tNovember. However, this did not influence the prices of oil significant.. The prices of refined petroleum products went down 3.8 per cent.
For other industrial groupings the prices of metals went up by 3.8 per cent. In this group the prices of both non-ferrous metals and iron and steel continued the up-turn by 4.3 and 3.3 per cent respectively.
Decline in the domestic market
For the domestic market, which includes goods produced and sold in Norway only, the index decreased by 1.7 per cent from September to October. The main difference from the "PPI for the domestic and export markets" is mainly due to the higher weight given to the electric power and lower weight given to the oil prices in the former index. This reflects the importance of oil in Norway's exports. Otherwise, the development of prices was fairly similar in the domestic and export markets.
A total rise of 5.8 per cent the last twelve months
Manufacturing prices went up 5.8 per cent from October 2005 to October 2006. The development was mainly to due to an increase in the prices of electric power, which is up 60.4 per cent. Metals are up 46.2 per cent, while the prices of crude oil and natural gas are up a modest 1.8 per cent compared to October last year. Coke and refined petroleum products are the only group with a negative change, and is down 8.4 per cent.
| Producer price index. 2000=100 |
| October 2006 | Changes, per cent | ||||||||||||||||||||||||||||||||||||||
|---|---|---|---|---|---|---|---|---|---|---|---|---|---|---|---|---|---|---|---|---|---|---|---|---|---|---|---|---|---|---|---|---|---|---|---|---|---|---|---|
| September 2006 - October 2006 | October 2005 - October 2006 | ||||||||||||||||||||||||||||||||||||||
| Total index | 135.6 | -1.3 | 5.8 | ||||||||||||||||||||||||||||||||||||
| Oil and gas extraction | 148.9 | -2.0 | 1.8 | ||||||||||||||||||||||||||||||||||||
| Manufacturing, mining and quarrying | 122.6 | 0.4 | 6.3 | ||||||||||||||||||||||||||||||||||||
| Electricity, gas and steam supply | 335.4 | -11.0 | 60.3 | ||||||||||||||||||||||||||||||||||||
| Commodity price index for the industrial sectors. 2000=100 |
| October 2006 | Changes, per cent | ||||||||||||||||||||||||||||||||||||||
|---|---|---|---|---|---|---|---|---|---|---|---|---|---|---|---|---|---|---|---|---|---|---|---|---|---|---|---|---|---|---|---|---|---|---|---|---|---|---|---|
| September 2006 - October 2006 | October 2005 - October 2006 | ||||||||||||||||||||||||||||||||||||||
| Total index | 141.6 | -1.3 | 5.8 | ||||||||||||||||||||||||||||||||||||
| Oil and gas extraction | 148.9 | -2.0 | 1.8 | ||||||||||||||||||||||||||||||||||||
| Manufacturing, mining and quarrying | 122.8 | 0.4 | 6.3 | ||||||||||||||||||||||||||||||||||||
| Electricity, gas and steam supply | 324.5 | -11.0 | 60.3 | ||||||||||||||||||||||||||||||||||||
Additional information
Contact
-
Producer price index
E-mail: produsentpris@ssb.no
tel.: (+47) 21 09 40 00
-
Elisabeth Mælum
E-mail: elisabeth.maelum@ssb.no
tel.: (+47) 97 01 28 49
-
Morten Madshus
E-mail: morten.madshus@ssb.no
tel.: (+47) 40 90 26 94
-
Monika Græsli Engebretsen
E-mail: monika.graesli.engebretsen@ssb.no
tel.: (+47) 40 90 23 71
-
Håvard Georg Jensen
E-mail: havard.jensen@ssb.no
tel.: (+47) 40 90 26 86

