Content
Published:
This is an archived release.
Mixed Developments in Commodity Prices
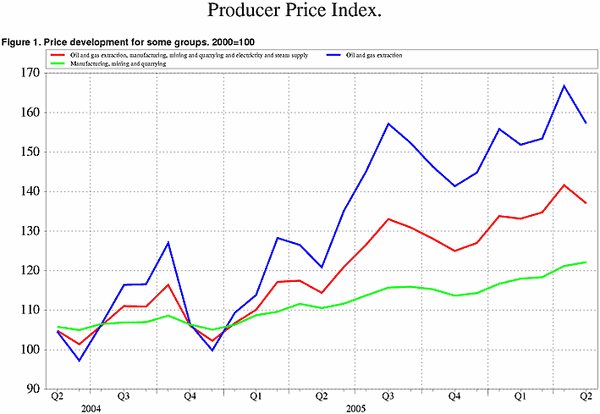
While prices of metals rose, the prices of crude oil and gas decreased in May. Along with a relatively dramatic price reduction of 20.1 per cent for electricity this yielded an over all fall of 3.21 per cent in the Producer Price Index.
After reaching an all-time high in April, the price level of oil and gas fell by 4.8 per cent in May. This follows a growth of 17.9 per cent over the period from November 2005 to April this year. A more dramatic reversion of long-term price development occurred in the electricity market: After a total increase of 52.8 per cent from November to April, the price of electricity fell by 20.1 per cent from April to May. The sub-index has not seen a one-month decrease this large since prices plummeted from January 2003, following a price-spike of historical proportions in the autumn and winter of 2002/ 2003.
Compared with the growth preceding the price-dives, however, the past month's reduction in electricity prices is noteworthy: Over the four months leading up to January 2003, the index for electricity increased by a massive 142 per cent. The subsequent fall before prices stabilized was around 40 per cent, with a tumble through the three months from January to March of -17.8, -20.3 and -15.2 per cent.
By comparison, the same sub-index grew 56per cent from November 2005 to March this year, followed by a slight 2per cent decrease from March to April before the relatively severe 20.1 per cent single-month dive. The past month's price reduction is much stronger compared to the preceding rise, than was the case the last time the electricity prices experienced a one-month reduction of more than 20 per cent. Thus, the price fall between April and May can be said to be dramatic in a historical context.
Continued increase in price of metals
Prices of metals, on the other hand, followed its long-term upward trend, with an increase of 4.8 per cent over the past month. Non-ferrous metals, a sub-index dominated by aluminum, saw a rise of 6.6 per cent, adding up to an index growth in this industry of 19.9 per cent since November.
Prices of electricity and the commodities mentioned above are generally more volatile than those of most manufactured goods. Indices of manufacturing industries saw relatively small changes from April to May, with an over all increase of 0.7 per cent.
The development in petroleum and electricity markets is also evident when we decompose the index by product type. Energy goods prices fell by 8per cent, while consumer goods, capital goods and intermediate goods saw growth rates of 0.5, 0.1 and 0.6 per cent, respectively.
A total rise of 19.8 per cent in twelve months
Despite the past month's fall, prices of crude oil and gas have increased by 30.2 per cent since May of last year. Along with an increase of 10.3 per cent in the index for manufacturing and mining over the past year, this yields a rise of 19.8 per cent in the total index. The only sub-indices with negative price growth rates over the past twelve months are the ones for the wood, pulp and paper industry and the electrical and optical equipment industry. These fell by 0.9 and 3.4 per cent, respectively.
| 1 | Corrected 9 June 2006 at 1020. |
| Producer price index. 2000=100 |
| May 2006 | Changes, per cent | ||||||||||||||||||||||||||||||||||||||
|---|---|---|---|---|---|---|---|---|---|---|---|---|---|---|---|---|---|---|---|---|---|---|---|---|---|---|---|---|---|---|---|---|---|---|---|---|---|---|---|
| April 2006 - May 2006 | May 2005 - May 2006 | ||||||||||||||||||||||||||||||||||||||
| Total index | 137.1 | -3.2 | 19.8 | ||||||||||||||||||||||||||||||||||||
| Oil and gas extraction | 157.3 | -5.6 | 30.2 | ||||||||||||||||||||||||||||||||||||
| Manufacturing, mining and quarrying | 122.1 | 0.8 | 10.3 | ||||||||||||||||||||||||||||||||||||
| Electricity, gas and steam supply | 248.6 | -20.1 | 19.2 | ||||||||||||||||||||||||||||||||||||
| Commodity price index for the industrial sectors. 2000=100 |
| May 2006 | Changes, per cent | ||||||||||||||||||||||||||||||||||||||
|---|---|---|---|---|---|---|---|---|---|---|---|---|---|---|---|---|---|---|---|---|---|---|---|---|---|---|---|---|---|---|---|---|---|---|---|---|---|---|---|
| April 2006 - May 2006 | May 2005 - May 2006 | ||||||||||||||||||||||||||||||||||||||
| Total index | 137.1 | -3.2 | 19.8 | ||||||||||||||||||||||||||||||||||||
| Oil and gas extraction | 157.3 | -5.6 | 30.2 | ||||||||||||||||||||||||||||||||||||
| Manufacturing, mining and quarrying | 122.1 | 0.8 | 10.3 | ||||||||||||||||||||||||||||||||||||
| Electricity, gas and steam supply | 248.6 | -20.1 | 19.2 | ||||||||||||||||||||||||||||||||||||
Additional information
Contact
-
Producer price index
E-mail: produsentpris@ssb.no
tel.: (+47) 21 09 40 00
-
Elisabeth Mælum
E-mail: elisabeth.maelum@ssb.no
tel.: (+47) 97 01 28 49
-
Morten Madshus
E-mail: morten.madshus@ssb.no
tel.: (+47) 40 90 26 94
-
Monika Græsli Engebretsen
E-mail: monika.graesli.engebretsen@ssb.no
tel.: (+47) 40 90 23 71
-
Håvard Georg Jensen
E-mail: havard.jensen@ssb.no
tel.: (+47) 40 90 26 86

