Content
Published:
This is an archived release.
Energy drives producer prices up
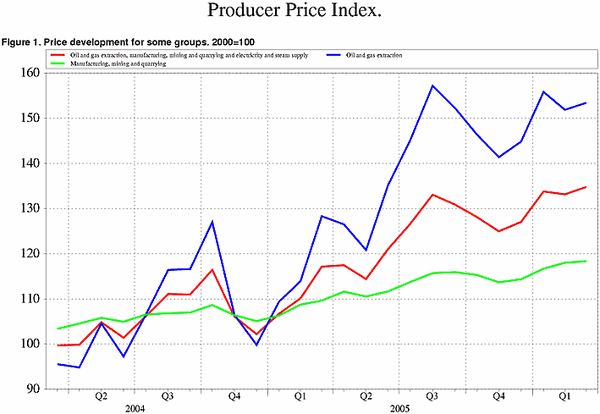
The Producer Price Index rose by 1.2 per cent from February to March. Prices of crude oil and gas grew 1.0 per cent, while electric power contributed to the overall rise with a significant price increase of 13.6 per cent.
After the slump in petroleum prices in February crude oil and gas had a slightly positive growth rate in March. Refined petroleum products also saw a reversion to trend, with a price increase of 3.0 per cent.
Contrarily, the price of metals fell by 2.7 per cent after a continuous and relatively steep rise since November last year. In this industry the past months' development was dominated by high grows in aluminum prices, which leveled off in March. At the same time the prices of several other metals and metal products had negative growth rates. This contributed to a modest 0.3 per cent price increase in the manufacturing, mining and quarrying industry.
Between November and March the price of electric power has seen a total growth of 56.1 per cent, 13.5 of which was added in the past month. This is mainly due to the lack of snow in hydroelectric power producing mountain regions.
The wood processing and paper industries experienced relatively high price growth in March, with rates 1.2 and 1.4 per cent respectively, compared with total rates 0.6 and 0.9 since March of last year. Prices of pulp, paper and paperboard have increased by 5.1 per cent since November.
Also by product type energy-related goods are driving the index up. With a rise of 2.2 per cent in March, following February's 1.8 per cent slump, it was the only product group with prices increasing more than 1 per cent. This is representative of long-term trends: The past three years energy products prices have grown at a relatively high rate, albeit with periodic fluctuations, while other prices follow a more stable and slowly rising path. A slight exception to this is the prices of intermediate goods, which fell by 0.4 per cent in March after an uncharacteristically high increase of 5.8 per cent between November and February.
The domestic market's share of the index was also dominated by the development in the energy sector. The price of electric power rose by 12.7 per cent, which along with generally low positive growth rates led to an overall rise of 1.6 per cent.
Lower than in February
The increase in the Producer Price Index over the past twelve months was 15.1 per cent, again reflecting the development in the energy sector. Energy goods prices rose by 23.4 per cent. The total yearly change is almost 6 percentage points lower than the same in February, reflecting a lower petroleum price increase compared with the same period of last year. Electricity, on the other hand, has grown at a relatively rapid pace the last few months versus the same period in 2005. Including this month's fall, intermediate goods prices have grown 5.3 per cent over the year. The manufacturing industry has seen a yearly price increase of 7.8 per cent.
| Producer price index. 2000=100 |
| March 2006 | Changes, per cent | ||||||||||||||||||||||||||||||||||||||
|---|---|---|---|---|---|---|---|---|---|---|---|---|---|---|---|---|---|---|---|---|---|---|---|---|---|---|---|---|---|---|---|---|---|---|---|---|---|---|---|
|
February 2006-
March 2006 |
March 2005-
March 2006 |
||||||||||||||||||||||||||||||||||||||
| Total index | 134.8 | 1.2 | 15.1 | ||||||||||||||||||||||||||||||||||||
| Oil and gas extraction | 153.4 | 1.0 | 19.6 | ||||||||||||||||||||||||||||||||||||
| Manufacturing, mining and quarrying | 118.4 | 0.3 | 7.8 | ||||||||||||||||||||||||||||||||||||
| Electricity, gas and steam supply | 317.6 | 13.5 | 55.2 | ||||||||||||||||||||||||||||||||||||
| Commodity price index for the industrial sectors. 2000=100 |
| March 2006 | Changes in per cent | ||||||||||||||||||||||||||||||||||||||
|---|---|---|---|---|---|---|---|---|---|---|---|---|---|---|---|---|---|---|---|---|---|---|---|---|---|---|---|---|---|---|---|---|---|---|---|---|---|---|---|
|
February 2006-
March 2006 |
March 2005-
March 2006 |
||||||||||||||||||||||||||||||||||||||
| Total index | 140.8 | 1.2 | 15.1 | ||||||||||||||||||||||||||||||||||||
| Oil and gas extraction | 153.4 | 1.0 | 19.6 | ||||||||||||||||||||||||||||||||||||
| Manufacturing, mining and quarrying | 118.6 | 0.3 | 7.8 | ||||||||||||||||||||||||||||||||||||
| Electricity, gas and steam supply | 307.3 | 13.5 | 55.1 | ||||||||||||||||||||||||||||||||||||
Additional information
Contact
-
Producer price index
E-mail: produsentpris@ssb.no
tel.: (+47) 21 09 40 00
-
Elisabeth Mælum
E-mail: elisabeth.maelum@ssb.no
tel.: (+47) 97 01 28 49
-
Morten Madshus
E-mail: morten.madshus@ssb.no
tel.: (+47) 40 90 26 94
-
Monika Græsli Engebretsen
E-mail: monika.graesli.engebretsen@ssb.no
tel.: (+47) 40 90 23 71
-
Håvard Georg Jensen
E-mail: havard.jensen@ssb.no
tel.: (+47) 40 90 26 86

