Content
Published:
This is an archived release.
Producer Price Index down 0.4 per cent
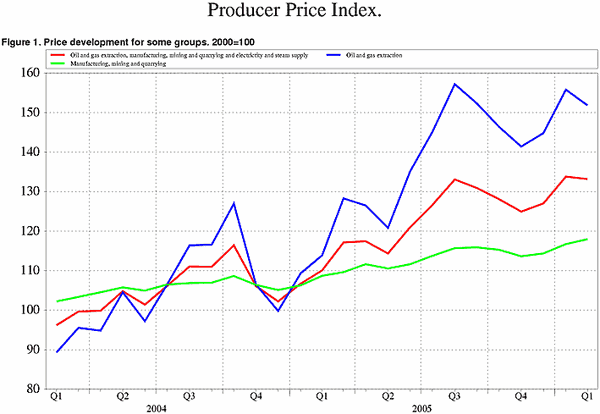
The Producer Price Index decreased by 0.4 per cent from January to February. This is mostly due to reduced prices of crude petroleum and gas, down 2.5 per cent. The industrial and mining prices are up 1.1 per cent while electricity continued its climb by 5.3 per cent.
Looking at the main industrial groupings we see that prices of basic metals showed a 6.5 per cent price rise. In this group the prices of basic precious and non-ferrous metals is the main contributor to the increase. This group has experienced an increase every month since September 2005. The reason for this development is the continued climb in the prices of aluminum. While the global aluminum surplus is rapidly growing the prices are in large driven by speculation and not lack of aluminum. The prices of electrical and optical products rose by 0.7 per cent in February. Machinery and equipment rose with 0.5 per cent while refined petroleum products had a 1.0 per cent price decrease compared to last month. There were only minor changes for the other divisions.
By main industrial groupings intermediate goods had a 2.4 per cent price increase while the prices of capital- and consumer goods rose by 0.2 and 0.5 per cent respectively. Prices of energy goods decreased by 1.8 per cent.
On the domestic market we had a price increase by 0.5 per cent. Oil and gas extraction experienced a reduction in prices by 3.0 per cent while electricity rose by 5.0 per cent. Manufacturing mining and quarrying prices rose by 0.5 per cent.
12-month rate, February 2005 to February 2006: Prices up 21.0 per cent
The increase in the Producer Price Index over the past twelve months has been caused by a general increase in prices of energy goods by 34.7 per cent. Intermediate- and consumer goods are up 5.7 and 3.8 per cent respectively. There has been no change in the capital goods in this 12-month period.
By industrial division, the prices of food products and beverages are up 5.5 per cent. Fish and fish products had the highest price increase in this group by 11.4 per cent. The other food products had an average price increase at about 4 per cent. Electrical and optical products decreased 4.5 per cent in this period. In this group the radio, television and communication equipment fell by 6.2 per cent.
| Producer price index. 2000=100 |
| February 2006 | Changes in per cent | ||||||||||||||||||||||||||||||||||||||
|---|---|---|---|---|---|---|---|---|---|---|---|---|---|---|---|---|---|---|---|---|---|---|---|---|---|---|---|---|---|---|---|---|---|---|---|---|---|---|---|
|
January 2006-
February 2006 |
February 2005-
February 2006 |
||||||||||||||||||||||||||||||||||||||
| Total index | 132.2 | -0.4 | 21.0 | ||||||||||||||||||||||||||||||||||||
| Oil and gas extraction | 151.9 | -2.5 | 33.4 | ||||||||||||||||||||||||||||||||||||
| Manufacturing, mining and quarrying | 118.0 | 1.1 | 8.4 | ||||||||||||||||||||||||||||||||||||
| Electricity, gas and steam supply | 279.8 | 5.3 | 46.4 | ||||||||||||||||||||||||||||||||||||
| Commodity price index for the industrial sectors. 2000=100 |
| February 2006 | Changes in per cent | ||||||||||||||||||||||||||||||||||||||
|---|---|---|---|---|---|---|---|---|---|---|---|---|---|---|---|---|---|---|---|---|---|---|---|---|---|---|---|---|---|---|---|---|---|---|---|---|---|---|---|
|
January 2006-
February 2006 |
February 2005-
February 2006 |
||||||||||||||||||||||||||||||||||||||
| Total index | 139.1 | -0.5 | 21.0 | ||||||||||||||||||||||||||||||||||||
| Oil and gas extraction | 151.9 | -2.5 | 33.4 | ||||||||||||||||||||||||||||||||||||
| Manufacturing, mining and quarrying | 118.2 | 1.1 | 8.3 | ||||||||||||||||||||||||||||||||||||
| Electricity, gas and steam supply | 270.7 | 5.4 | 46.4 | ||||||||||||||||||||||||||||||||||||
Additional information
Contact
-
Producer price index
E-mail: produsentpris@ssb.no
tel.: (+47) 21 09 40 00
-
Elisabeth Mælum
E-mail: elisabeth.maelum@ssb.no
tel.: (+47) 97 01 28 49
-
Morten Madshus
E-mail: morten.madshus@ssb.no
tel.: (+47) 40 90 26 94
-
Monika Græsli Engebretsen
E-mail: monika.graesli.engebretsen@ssb.no
tel.: (+47) 40 90 23 71
-
Håvard Georg Jensen
E-mail: havard.jensen@ssb.no
tel.: (+47) 40 90 26 86

