Content
Published:
This is an archived release.
Prices of energy goods up 55 per cent
Prices of energy goods have soared 55 per cent since December last year. The total index has increased by 30 per cent in the same period. From July to August this year, the total index increased by 5.1 per cent. Manufacturing prices increased by 1.8 per cent in the same period.
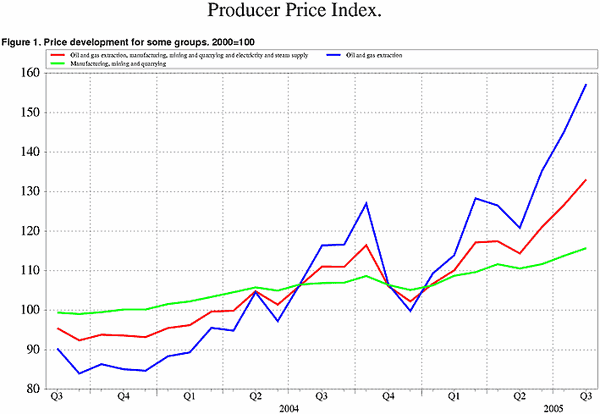
Compared with December last year, prices of both refined petroleum products and Brent Blend have increased by roughly 70 per cent. Prices of electricity have remained more or less unchanged. In the same period, manufacturing prices have risen by 10 per cent. However, if the price effect of refined petroleum products is disregarded the increase is only 1.9 per cent.
From July to August, prices within oil and gas extraction increased by 8.3 per cent, while electricity prices increased by 3.7 per cent. The rise in manufacturing prices was influenced by higher export prices of refined petroleum products and basic metals. According to the London Spot Market, prices of unleaded gasoline rose by 8.8 per cent from July to August. Prices of food increased by 0.6 per cent.
Among the main industrial groupings, prices of intermediate goods and consumer goods rose by 0.6 per cent, and energy goods rose by 8.1 per cent.
On the domestic market the total index only increased 1.7 per cent. A smaller rise in domestic prices of refined petroleum products and a decline in prices of basic metals were the reasons for the modest increase.
12-month rate, August 2004 to August 2005: 8.3 per cent increase in manufacturing
The rise in manufacturing prices over the last 12 months is mainly due to a 48 per cent increase in prices of refined petroleum products. If these products are left out, the remaining manufacturing commodities have increased by 2.0 per cent, mainly due to a 3.8 per cent and 4.4 per cent increase in prices of food and basic metals respectively. Falling prices within wood processing and electrical and optical equipment partly offset this increase.
| Producer price index. 2000=100 |
| August 2005 | Changes, per cent | ||||||||||||||||||||||||||||||||||||||
|---|---|---|---|---|---|---|---|---|---|---|---|---|---|---|---|---|---|---|---|---|---|---|---|---|---|---|---|---|---|---|---|---|---|---|---|---|---|---|---|
| July 2005-August 2005 | August 2004-August 2005 | ||||||||||||||||||||||||||||||||||||||
| Total index | 133.1 | 5.1 | 19.9 | ||||||||||||||||||||||||||||||||||||
| Oil and gas extraction | 157.2 | 8.3 | 35.1 | ||||||||||||||||||||||||||||||||||||
| Manufacturing, mining and quarrying | 115.8 | 1.8 | 8.2 | ||||||||||||||||||||||||||||||||||||
| Electricity, gas and steam supply | 206.6 | 3.7 | -12.1 | ||||||||||||||||||||||||||||||||||||
Commodity price index for industrial sectors
As announced previously, the two articles for the Producer Price Index and the Commodity Price Index for the industrial sectors have been combined into one article. The web pages for both surveys will remain the same for the time being - http://www.ssb.no/ppi_en/ and http://www.ssb.no/vppi_en/ .
| Commodity price index for the industrial sectors. 2000=100 |
| August 2005 | Changes, per cent | ||||||||||||||||||||||||||||||||||||||
|---|---|---|---|---|---|---|---|---|---|---|---|---|---|---|---|---|---|---|---|---|---|---|---|---|---|---|---|---|---|---|---|---|---|---|---|---|---|---|---|
| July 2005-August 2005 | August 2004-August 2005 | ||||||||||||||||||||||||||||||||||||||
| Total index | 139.0 | 5.1 | 19.8 | ||||||||||||||||||||||||||||||||||||
| Oil and gas extraction | 157.2 | 8.3 | 35.1 | ||||||||||||||||||||||||||||||||||||
| Manufacturing, mining and quarrying | 116.0 | 1.8 | 8.2 | ||||||||||||||||||||||||||||||||||||
| Electricity, gas and steam supply | 199.8 | 3.6 | -12.1 | ||||||||||||||||||||||||||||||||||||
Additional information
Contact
-
Producer price index
E-mail: produsentpris@ssb.no
tel.: (+47) 21 09 40 00
-
Elisabeth Mælum
E-mail: elisabeth.maelum@ssb.no
tel.: (+47) 97 01 28 49
-
Morten Madshus
E-mail: morten.madshus@ssb.no
tel.: (+47) 40 90 26 94
-
Monika Græsli Engebretsen
E-mail: monika.graesli.engebretsen@ssb.no
tel.: (+47) 40 90 23 71
-
Håvard Georg Jensen
E-mail: havard.jensen@ssb.no
tel.: (+47) 40 90 26 86