Content
Published:
This is an archived release.
Prices of oil still rising
The total index climbed by 0.6 per cent from November to December, and yet again oil and oil-related products was the main contributor to the rise. Manufacturing prices increased as well, thereby contributing to the rise in the total index.

The price of Brent Blend increased by almost 5 per cent from last month and levelled out at roughly 25.50 US dollars a barrel. This ends a year with galloping oil prices. The December price in 1999 was a huge 156 per cent higher than its counterpart in 1998 (measured in USD). OPEC's ability to maintain their cutbacks is the main reason for most of this year's climb. Other factors that made the oil price increase the last month were the cold weather in the western hemisphere, fright for a mishap crossing into a new millennium making buyers build up stocks and the Iraq temporary withdrawal from the oil market.
The oil extraction, mining and quarrying increased by 2.6 per cent compared with November. This group showed a yearly growth of 19.6 per cent, while a comparison between the 4. Quarter 1998 and the 4. Quarter 1999 shows an increase of about 43 per cent. This is due to a steep climb in prices towards the end of the year combined with a reduction in oil prices in 1998.
Metal prices up
From November to December the manufacturing prices rose by 0.5 per cent. The largest contribution to this rise came from the refined oil products. The group manufacture of chemicals and chemical petroleum, coal, rubber and plastic products increased by 2.1 per cent compared with last month. Looking at exports metals also contributed with an increase of 0.8 per cent. Metal prices were mostly influenced by non-ferrous metals.
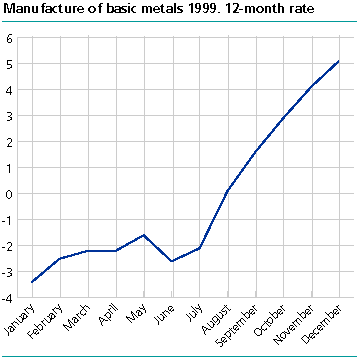
Metals showed a negative yearly growth of 0.2 percent, despite the 12-month rate in December of 5 per cent. This is somewhat due to the crises in Asia in 1998, which caused a reduced demand for goods on the world marked and lower prices. This market began to recover in 1999 and prices have shown great increase in the second half. As the figure shows the 12-month rate (December 1998 to December 1999) did not brake the zero-barrier before August. On the London Spot Market the price of aluminium increased by roughly 2.5 per cent from November to December, while the 12-month rate showed more or less a 23 per cent rise.
| Producer price index. 1981=100 |
| December 1999 | Changes, per cent | ||||||||||||||||||
|---|---|---|---|---|---|---|---|---|---|---|---|---|---|---|---|---|---|---|---|
| November 1999-December 1999 | December 1998-december 1999 | January-december 1998-january-december 1999 | |||||||||||||||||
| Total index | 172,7 | 0,6 | 6,8 | 3,0 | |||||||||||||||
| Oil extraction, mining and quarrying | 123,0 | 2,6 | 51,7 | 19,6 | |||||||||||||||
| Manufacturing | 177,8 | 0,5 | 3,3 | 1,7 | |||||||||||||||
| Manufacture of food, beverages and tobacco | 202,6 | 0,2 | -0,5 | 1,0 | |||||||||||||||
| Manufacture of textiles, wearing apparel, leather and leather products | 159,1 | 0,2 | 0,4 | 0,9 | |||||||||||||||
| Manufacture of wood and wood products | 189,0 | 0,1 | 1,6 | -0,1 | |||||||||||||||
| Manufacture of paper and paper products, printing and publishing | 202,9 | -0,4 | 2,8 | 2,7 | |||||||||||||||
| Manufacture of chemicals and chemical petroleum, coal, rubber and plastic products | 141,8 | 2,1 | 15,6 | 5,0 | |||||||||||||||
| Manufacture of mineral products | 215,3 | - | 1,7 | 1,9 | |||||||||||||||
| Manufacture of basic metals | 139,8 | 0,8 | 5,1 | -0,2 | |||||||||||||||
| Manufacture of fabricated metal products, machinery and equipment | 188,8 | -0,1 | 1,1 | 1,6 | |||||||||||||||
Additional information
Contact
-
Producer price index
E-mail: produsentpris@ssb.no
tel.: (+47) 21 09 40 00
-
Elisabeth Mælum
E-mail: elisabeth.maelum@ssb.no
tel.: (+47) 97 01 28 49
-
Morten Madshus
E-mail: morten.madshus@ssb.no
tel.: (+47) 40 90 26 94
-
Monika Græsli Engebretsen
E-mail: monika.graesli.engebretsen@ssb.no
tel.: (+47) 40 90 23 71
-
Håvard Georg Jensen
E-mail: havard.jensen@ssb.no
tel.: (+47) 40 90 26 86

